ॐ ह्रीं श्रीं लक्ष्मीभयो नमः॥


Trading "calls" from our "Software" with more than "90% accuracy"

 This is the "Oldest & Only Website" of whole World
which is updating Nifty & Indian Stock Markets
"Daily and Weekly accurate Outlooks" 
with "Intraday Charts Analysis"for the 
last more than "14 years" means from "2010"
For its live Proofs just see "Archive"
in the "bottom of this Website".
For next big moves firstly watch
 immediate supports,resistances &
 finally last 27 Sessions trading range
Technical Analysis,Research & Weekly
 Outlook(Sep 12 to Sep 16,2022)
Nifty-EOD Chart Analysis
(Waves structure)
Nifty-EOD Chart (12-Sep-2022):-
Technical Patterns and Formations in EOD charts

1- Corrective Wave-C completion and Impulsive Wave-1 beginning from 7511.10 on 24-03-2020.
2- Impulsive Wave-1 completion at 11794.30 on 31-08-2020.  
3- Corrective Wave-2 completion at 10790.20 on 24-09-2020.
4- Impulsive Wave-3 completion at 15431.8 on 16-02-2021.
5- Corrective Wave-4 completion at 14151.4 on 22-04-2021.
6- Impulsive Wave-5 completion after new life time top formation at 18604.50 on 19-10-2021 and corrective Wave-A of "ABC" correction beginning with Double Zig-Zag pattern formation. 
7- Wave-A completion at 16410.20 on 20-12-2021.
8- Wave-B completion at 18351.00 on 18-01-2022.
9- Wave-C bottom formation at 15671.5 on 08-03-2022.
10- Wave-X completion at 18114.70 on 04-04-2022.
11- Wave-A completion at 15735.80 on 12-05-2021.
12- Wave-B completion at 16793.80 on 03-06-2022.
13- Wave-C completion at 15183.4 on 17-06-2022.
14- Wave-A continuation with recent top formation at 17992.20 on 19-08-2022.
15- Last 27 Sessions sideways correction between 17167-17992.

Conclusions from EOD chart analysis
(Waves structure)

Impulsive Wave-1 of which Waves structure begun from 7511.10 on 24-03-2020 completed through its impulsive Wave-5 at 18604.50 on 19-10-2021 after 11093.4 points gains in almost 21 months and its Wave-A of "ABC" correction begins. 

Now more than 10 months old "ABC" correction is in continuation with Double Zig-Zag pattern formation and lost maximum 3421.1 points loss. At present Wave-A of on going correction is on with recent top formation at 17992.20 on 19-08-2022 and no confirmation of its completion yet but now its  27 Sessions sideways correction is in continuation between 17167-17992 with recent bottom formation at 17166.2 on 29-08-2022.

Nifty-EOD Chart Analysis
(Stochastic & MACD)
Nifty-EOD Chart (12-Sep-2022):-
Technical Patterns and Formations in EOD charts

1- Wave-C completion at 15183.4 on 17-06-2022 and Wave-A beginning.
2- Wave-A continuation with recent top formation at 17992.20 on 19-08-2022.
3- Last 27 Sessions sideways correction between 17167-17992.
4- Stochastic- Both %K(5) line and %D(3) line are kissing just below Over bought zone.
5- Stochastic:- %K(5)- 76.33 & %D(3)- 72.05.
6- In MACD- Both MACD line and Average line are kissing just above Zero line.
7- MACD(26,12)- 04.94 & EXP(9)- 51.37 & Divergence- -46.43.

Conclusions from EOD chart analysis
(Stochastic & MACD)

Wave-A of "ABC" Double Zig-Zag pattern correction continuation with recent top formation at 17992.20 on 19-08-2022 and no confirmation of its completion yet on EOD charts. Last 27 Sessions sideways trading between 17167-17992 and finally sustaining beyond this range will confirm  next one sided big moves beginning after breaking out/breaking down of this 27 Sessions like big trading range.

As both lines are kissing in Short Term indicators MACD and Stochastic therefore it will be understood that Indian markets are in indecisive and confusion mode. Let Short Term indicators show one sided signals then next Short Term trend will be understood accordingly.  

Nifty-Intra Day Chart Analysis
(09-Sep-2022)
Nifty-Intra Day Chart (09-Sep-2022):-
Technical Patterns formation in today intraday charts

1- Selling between 17887-17925
2- 2 Hours Down moves in Bullish Falling Channel
3- Selling between 17833-17867
4- Whole day actual trading between 17786-17925

Conclusions from intra day chart analysis 

Although gap up strong opening last Friday but higher levels selling developed and follow up selling was also seen in last hours therefore closing was near the lower levels of the day. As 2 hours Mid-session Down moves were in Bullish Falling Channel therefore intraday consolidation was also seen hence last Friday intraday trafing will be understood with Mixed Patterns formation. Expected that Nifty will firstly trade and prepare for next decisive moves within and near about 17786-17925 and finally sustaining beyong this range will confirm it therefore should be watched in the beginning of next week. 

Conclusions
(After putting all studies together)

All the trends are up and "ABC" correction which started more than 10 months before is in continuation with Double Zig-Zag pattern formation as well as no confirmation of its completion yet.

Now Wave-A of correction is on with recent top formation at 17992.20 on 19-08-2022. As last 27 Sessions sideways trading between 17167-17992 and finally sustaining beyond this range will confirm life and length of on going correction therefore should be firstly watched in the coming week/weeks for next decisive one sided big moves beginning confirmations. Next supports and resistances between 17167-17992 are as follows:-

Immediate resistances:-

1- 17833-17867
2- 17887-17925
3- 17934-17979

Immediate supports:-

1- 17706-17748
2- 17477-17591
3- 17381-17401(Gap support)
4- 17226-17380

Firstly sustaining beyond above mentioned supports and resistances should be watched in the coming week/weeks for initial signals of next big moves beginning which will finally get 100% confirmation after break out/down of last 27 Sessions trading range(17167-17992).
 Resistance range will confirm 
next intraday moves
Nifty-Intra Day Chart Analysis & 
Market Outlook(09-09-2022)
Nifty-Intra Day Chart (08-Sep-2022):-
Technical Patterns formation in today intraday charts

1- Down moves in Bullish Falling Channel
2- Up moves in Bearish Rising Channel
3- Whole day actual trading between 17692-17807

Conclusions from intra day chart analysis 

As firstly Down moves in Bullish Falling Channel after stong opening therefore up moves started from intraday lower levels which remained continued till last hour. Up moves in last 3 hours were in Bearish Rising Channel and within next resistance range also between 17762-17834 therefore:- 

1- Firstly fresh consolidation is required for intraday up moves above 17834.
and 
2- Fresh selling within or near about 17762-17834 and sustaining below 17762 will mean intraday correction beginning.
 17598-17650 will confirm next intraday trend
Nifty-Intra Day Chart Analysis & 
Market Outlook(08-09-2022)
Nifty-Intra Day Chart (07-Sep-2022):-
Technical Patterns formation in today intraday charts

1- Consolidation between 17532-17591
2- Sharp up moves in Mid-session
3- Last 4 hours sideways trading between 17598-17650
4- Whole day actual trading between 17485-17650

Conclusions from intra day chart analysis 

Although firstly gap down opening but firstly consolidation between 17532-17591 therefore sharp up moves developed in Mid-session. As last 4 hours sideways trading between 17598-17650 and one sided intraday trading patterns were not seen therefore firstly sustaining beyond this range should be watched tomorrow for next intraday trend beginning confirmations.
 Firstly down moves & today 
lowest will confirm sharp fall
Nifty-Intra Day Chart Analysis & 
Market Outlook(07-09-2022)
Nifty-Intra Day Chart (06-Sep-2022):-
Technical Patterns formation in today intraday charts

1- 177 Points fall in first hour after positive opening
2- Up moves with downward corrections
3- Selling between 17672-17715
4- Sharp fall in last hour
5- Whole day actual trading between 17588-17764

Conclusions from intra day chart analysis 

Although firstly up moves after positive opening but 177 Points fall in first hour and after that some up moves were seen. As selling developed in Mid-session and intrday consolidation was not seen therefore sharp fall in last hour and firstly down moves are expected towards today lowest(17588),once sustaining below it will mean sharp fall towards next supports between 17477-17533.
 As out of station therefore could not update Stock Market Outlook of today(06-09-2022) but tomorrow Outlook will be posted positively.
 Last 22 Sessions sideways 
correction range break out/down 
will confirm next trend
Technical Analysis,Research & 
Weekly Outlook(Sep 05 to Sep 09,2022)
Nifty-EOD Chart Analysis
(Stochastic & MACD)
Nifty-EOD Chart (02-Sep-2022):-
Technical Patterns and Formations in EOD charts

1- Wave-C completion at 15183.4 on 17-06-2022 and Wave-A beginning
2- Wave-A continuation with recent top formation at 17992.20 on 19-08-2022
3- 22 Sessions sideways correction between 17155-17992
4- Stochastic- %K(5) line has intersected %D(3) line upward and its both lines are rising towards Over bought zone.
5- Stochastic:- %K(5)- 73.21 & %D(3)- 64.85.
6- In MACD- MACD line has intersected Average line downward and its both lines are falling in positive zone.
7- MACD(26,12)- 14.13 & EXP(9)- 288.33 & Divergence- -274.02

Conclusions from EOD chart analysis
(Stochastic & MACD)

Wave-A of "ABC" correction continuation is in continuation with recent top formation at 17992.20 on 19-08-2022 and no confirmation of its completion yet but last 22 Sessions sideways corretcion between 17155-17992 and finally sustaining beyond this range will confirm life and length of on going correction.

Although MACD is showing downward trend formations signals but both lines of Stochastic are rising towards Over bought zone and are just below Over bought zone also therefore correction continuation may be seen after some up moves.  

Nifty-Last 10 Sessions
intraday charts analysis
Nifty-Intra Day Chart (Aug 19 to Sep 02,2022):-
Technical Patterns formation in last 10 Sessions intraday charts

1- Selling(Resistances) in last 10 Sessions are as follows:-
A- 17582-17619
B- 17634-17726 
C- 17762-17834 
D- 17934-17979 
2- Consolidation(Supports) in last 10 Sessions are as follows:-
A- 17477-17533 
B- 17381-17401(Gap support)
C- 17226-17380
3- Last 10 Sessions actual trading between 17167-17992 

Conclusions from 10 Sessions
intra day chart analysis 

As last 10 Sessions trading between 17167-17992 with above mentioned supports and resistances which are almost equally stronger also therefore firstly sustaining beyond this range should be watched in the coming week for next Short to Intermediate term moves beginning confirmations.

Nifty-Intra Day Chart Analysis
(02-Sep-2022)
Nifty-Intra Day Chart (02-Sep-2022):-
Technical Patterns formation in today intraday charts

1- Down moves in Bullish Falling Channel
2- Consolidation between 17477-17533
3- Up moves in Bearish Rising Channel
4- Sharp fall in last hour
5- Whole day actual trading between 17477-17643

Conclusions from intra day chart analysis 

As good intraday selling one day before therefore Nifty could not sustain at higher levels and slipped after positive opening last Friday. Although firstly down moves but were in Bullish Falling Channel and lower levels consolidation also therefore up moves started. As Mid-session up moves were in Bearish Rising Channel therefore sharp fall was seen in last hour.

Lower levels consolidation and higher levels selling was seen between 17477-17643 last fiday therefore valid breakout of this range should be firstly watched in coming week for next decisive moves beginning confirmations.

Conclusions
(After putting all studies together)

1- Long Term Trend is up.
2- Intermediate Term Trend is up.
3- Short Term Trend is sideways.

More than 10 months old "ABC" correction continuation with Double Zig-Zag pattern formations and no confirmation of its completion yet. Now its Wave-A is on after gaining 2808.8 points in the last 48 sessions. 

As last 22 Sessions sideways correction of Wave-A is being seen between 17155-17992 and above mentioned supports and resistances of last 10 sessions will decide the fate of this 22 sessions range. Finally last 22 Sessions sideways correction range break out/down will confirm next trend therefore should be firstly watched in the coming week/weeks for:-

1- Fresh rally after sideways correction completion above 17992.
2- Deeper correction beginning after breaking down below 17155. 
 Down moves expectations 
towards immediate supports
Nifty-Intra Day Chart Analysis & 
Market Outlook(02-09-2022)
Nifty-Intra Day Chart (01-Sep-2022):-
Technical Patterns formation in today intraday charts

1- Firstly up moves after weaker opening
2- Selling between 17634-17695
3- Selling between 17582-17619
4- Selling between 17525-17578
5- Whole day actual trading between 17469-17695

Conclusions from intra day chart analysis 

Although firstly up moves after weaker opening but Nifty could not moved above immediate resistance range(17522-17726) and down moves started which remained continued with whole day continuous selling. As whole day good intraday selling therefore down moves are expected below day's lowest(17469) and towards immediate supports(17226-17380).
 Immediate supports and resistances 
will confirm Short Term moves
 amid melting Global markets 
Nifty-Intra Day Chart Analysis & 
Market Outlook(01-09-2022)
Nifty-Intra Day Chart (30-Aug-2022):-
Technical Patterns formation in today intraday charts

1- Whole day rally after gap up strong opening
2- Whole day actual trading between 17402-17777

Conclusions from intra day chart analysis 

Although whole day rally after gap up strong opening on 30-08-2022 and closing was above 2 immediate resistances as well as intraday selling patterns were not seen but Global markets are melting therefore SGX Nifty is trading more than 200 points down at this moment. 

As Global markets led intraday volatility may be seen tomorrow therefore sustaining beyond following immediate supports and resistances should be watched in the coming sessions for Short Term moves beginning confirmations :-

1- Immediate supports are between 17226-17380 
2- Immediate resistances are between 17522-17726
 17226-17380 Will confirm 
next Short terms moves
Nifty-Intra Day Chart Analysis & 
Market Outlook(30-08-2022)
Nifty-Intra Day Chart (29-Aug-2022):-
Technical Patterns formation in today intraday charts

1- 160 Points jump from lower levels in first 48 minutes after huge gap down opening
2- More than 5 hours sideways trading between 17294-17380
3- Whole day actual trading between 17167-17380

Conclusions from intra day chart analysis 


As supports between 17226-17293 are strong therefore firstly sustaining it beyond should be watched in next week 

Nifty honoured already mentioned strong supports between 17226-17293 in following manner today:-

1- Although crashing Global markets led huge gap down opening below 17226 but not sustaining below it and sharp 160 points jump was seen from lower levels in first 48 minutes today morning.
2- Last More than 5 hours sideways trading was above 17293 between 17294-17380 today.

As clear one sided trading patterns were not seen between 17294-17380 today therefore firstly sustaining beyond 17226-17380 should be watched in the coming sessions for next Short terms moves beginning confirmations because:-

1- Clear and complete fresh selling patterns are firstly required for sustaining below strong supports lowest(17226).
2- Fresh consolidation and sustaining above 17380 will mean decisive up moves beginning after honouring strong supports range(17226-17293)
Correction continuation & strong
 supports breaking down will
 confirm deeper correction
Technical Analysis,Research & Weekly 
Outlook(Aug 29 to Sep 02,2022)
Nifty-EOD Chart Analysis
(Waves structure)
Nifty-EOD Chart (26-Aug-2022):-
Technical Patterns and Formations in EOD charts

1- Corrective Wave-C completion and Impulsive Wave-1 beginning from 7511.10 on 24-03-2020
2- Impulsive Wave-1 completion at 11794.30 on 31-08-2020  
3- Corrective Wave-2 completion at 10790.20 on 24-09-2020
4- Impulsive Wave-3 completion at 15431.8 on 16-02-2021
5- Corrective Wave-4 completion at 14151.4 on 22-04-2021
6- Impulsive Wave-5 completion after new life time top formation at 18604.50 on 19-10-2021 and corrective Wave-A of "ABC" correction beginning with Double Zig-Zag pattern formation 
7- Wave-A completion at 16410.20 on 20-12-2021
8- Wave-B completion at 18351.00 on 18-01-2022
9- Wave-C bottom formation at 15671.5 on 08-03-2022
10- Wave-X completion at 18114.70 on 04-04-2022
11- Wave-A completion at 15735.80 on 12-05-2021
12- Wave-B completion at 16793.80 on 03-06-2022
13- Wave-C completion at 15183.4 on 17-06-2022
14- Wave-A continuation with recent top formation at 17992.20 on 19-08-2022
15- Wave-A correction continuation recent bottom formation at 17345.2 on 23-08-2022

Conclusions from EOD chart analysis
(Waves structure)

Waves structure which begun from 7511.10 on 24-03-2020 through its impulsive Wave-1 completed through its impulsive Wave-5 at 18604.50 on 19-10-2021 after 11093.4 points gains in almost 21 months and its Wave-A of "ABC" correction begins. 

Now more than 10 months old "ABC" correction continuation with maximum 3421.1 points loss and Double Zig-Zag pattern formation. At present Wave-A of on going correction continuation with recent top formation at 17992.20 on 19-08-2022 and no confirmation of its completion yet but now its correction is on with recent bottom formation at 17345.2 on 23-08-2022.

Nifty-Weekly Chart Analysis
(Stochastic & MACD)
Nifty-Weekly Chart (26-Aug-2022):-
Technical Patterns and Formations in EOD charts

1- Impulsive Wave-5 completion after new life time top formation at 18604.50 on 19-10-2021 and corrective Wave-A of "ABC" correction beginning with Double Zig-Zag pattern formation 
2- Wave-A continuation with recent top formation at 17992.20 on 19-08-2022
3- Wave-A correction continuation recent bottom formation at 17345.2 on 23-08-2022
4- Stochastic- %K(5) line has intersected %D(3) line downward and its both lines are falling within Over bought zone.
5- Stochastic:- %K(5)- 86.02 & %D(3)- 92.39.
6- In MACD- MACD line has intersected Average line upward and its both lines are rising.
7- MACD(26,12)- 150.77 & EXP(9)- -383.96 & Divergence- 534.73

Conclusions from Weekly chart analysis
(Stochastic & MACD)

Although no confirmation of Wave-A completion but its correction has started and in continuation with  recent bottom formation at 17345.2 on 23-08-2022. Positions of Weekly indicators are as follows:-

1- In Stochastic indicator %K(5) line has intersected %D(3) line downward and its both lines are falling within Over bought zone therefore showing strong signals of Intermedaite Term correction continuation.
2- In MACD indicator MACD line has intersected Average line upward and its both lines are rising therefore suggesting that Intermediate Term upward trend is still intact.

Nifty-EOD Chart Analysis
(Averages)
Nifty-EOD Chart (26-Aug-2022):-
Technical Patterns and Formations in EOD charts

Averages:-

A- 5-Day SMA is today at 17550 
B- 21-Day SMA is today at 17487
C- 55-Day SMA is today at 16549
D- 100-Day SMA is today at 16643
E- 200-Day SMA is today at 16979
 
Conclusions from EOD chart analysis
(Averages)

Nifty is well above Long and Intermediate Term trend(55,100,200-Day SMA) deciding Averages but hovering near about Short Term trend(5 & 21-Day SMA) and firstly sustaining it(17550 & 17487) beyond should be watched in next week for on going correction continuation or completion.

Nifty-Last 5 Sessions
intraday charts analysis
Nifty-Intra Day Chart (Aug 22 to Aug 26,2022):-
Technical Patterns formation in last 5 Sessions intraday charts

1- Selling(Resistances) in last 5 sessions are as follows:-
A- 17671-17726 
B- 17522-17627  
2- Consolidation(Supports) in last 5 sessions are as follows:-
A- 17425-17470 
3- Last 5 Sessions trading between 17346-17726 

Conclusions from 5 Sessions
intra day chart analysis 

Last 5 Sessions trading between 17346-17726 with above mentioned supports and resistances. As higher levels resistances are much stronger than lower levels supports and good intraday selling was seen last Friday also therefore firstly down moves are expected towards above mentioned supports. Finally sustaining below 17425 will mean strong signals of deeper correction beginning after last 10 sessions actual trading range breaking down confirmations therefore should be firstly watched in next week for its confirmations.

Conclusions
(After putting all studies together)

1- Long Term Trend is up.
2- Intermediate Term Trend is up.
3- Short Term Trend is down.

At present correction of Wave-A is on and no indication of its completion yet on EOD and intraday charts. As intraday charts of both previous sessions are showing selling patterns formations also therefore on going correction continuation is expected in the beginning of next week and finally sustaining beyond 21-Day SMA(17487) will confirm the life and length of on going correction.

Although Intermedaite Term indicator Weekly MACD is showing upward trend but Weekly Stochastic is confirming decisive down moves beginning therefore firstly on oging correction will remained continued in next week towards following next supports:-

1- 17425-17470
2- 17366-17428
3- 17226-17293(Strong supports)

As supports between 17226-17293 are strong therefore firstly sustaining it beyond should be watched in next week because sustaining below 17226 will open the gate of deeper correction beginning towards following next supports after last 17 sessions trading range breaking down confirmations:-

1- 17061-17121
2- 16948-17018(Gap supports)
3- 16654-16746(Gap supports)
4- 16565-16628
5- 16495-16542
Immediate supports will confirm 
next intraday decisive moves
Nifty-Intra Day Chart Analysis & 
Market Outlook(26-08-2022)
Nifty-Intra Day Chart (25-Aug-2022):-
Technical Patterns formation in today intraday charts

1- Selling between 17671-17726
2- Sharp fall in last hours
3- Whole day actual trading between 17488-17726

Conclusions from intra day chart analysis 

Although firstly up moves after gap up opening but good selling developed which remained continued more than 4 hours therefore sharp fall was seen in last hours.

3 Resistances were updated above today selling range(17671-17726) on 20-08-2022 in "Watch next Levels & Supports after 2808 points gaining 44 sessions old Wave-A rally correction beginning" and fresh good selling was seen below it today therefore these resistances have become stronger and until complete consolidation will not develop till then decisive up moves will not be seen above 17726.

As immediate supports are between 17425-17470 therefore firstly sustaining it beyond should be watched tomorrow for next intraday decisive moves beginning confirmations.
Outlook for 23-08-2022 has been updated below just now but I shall not be able to post Outlook for the next 1 or 2 sessions because going out of station today.
Correction continuation towards
 next supports
Nifty-Intra Day Chart Analysis & 
Market Outlook(23-08-2022)
Nifty-Intra Day Chart (22-Aug-2022):-
Technical Patterns formation in today intraday charts

1- 128 Points sharp fall in first 3 minutes after gap down opening
2- More than 4 hours selling between 17522-17595
3- Down moves in last hour
4- Whole day actual trading between 17468-17690

Conclusions from intra day chart analysis

Live Proofs of our 100% accurate 
Nifty analysis 


firstly down moves and intraday trading is expected within today trading range tomorrow

As was told 100% same happened and Nifty 
closed 198 points down on 19-08-2022 


A- Friday started correction is expected in the beginning of next week also.
B- strong signals of its correction have emerged in previous week on intraday,EOD and Weekly charts

As was told 100% same happened and 
Nifty closed 267 Points down today

Today 128 points sharp fall in first 3 minutes and after that more more than 4 hours good selling between 17522-17595 therefore down remained continue till last hour. As only intraday selling today therefore correction continuation is expected in the coming sessions towards those next supports which have already been posted in previous Outlook on 20-08-2022.
Watch next Levels & Supports after 2808 points gaining 44 sessions old Wave-A rally correction beginning
Technical Analysis,Research & Weekly Outlook
(Aug 22 to Aug 26,2022)
Nifty-EOD Chart Analysis
(Stochastic & MACD)
Nifty-EOD Chart (19-Aug-2022):-
Technical Patterns and Formations in EOD charts

1- Impulsive Wave-5 completion after new life time top formation at 18604.50 on 19-10-2021 and corrective Wave-A of "ABC" correction beginning with Double Zig-Zag pattern formation 
2- Wave-A completion at 16410.20 on 20-12-2021
3- Wave-B completion at 18351.00 on 18-01-2022
4- Wave-C bottom formation at 15671.5 on 08-03-2022
5- Wave-X completion at 18114.70 on 04-04-2022
6- Wave-A completion at 15735.80 on 12-05-2021
7- Wave-B completion at 16793.80 on 03-06-2022
8- Wave-C completion at 15183.4 on 17-06-2022 and Wave-A beginning
9- Wave-A continuation with recent top formation at 17992.20 on 19-08-2022
10- Stochastic- %K(5) line has intersected %D(3) line downward and its both lines are falling within Over Over bought zone.
11- Stochastic:- %K(5)- 77.78 & %D(3)- 89.89.
12- Stochastic is showing negative divergence
13- In MACD- MACD line has intersected Average line downward and its both lines are falling in positive zone.
14- MACD(26,12)- 570.18 & EXP(9)- 613.32 & Divergence- -43.14

Conclusions from EOD chart analysis
(Stochastic & MACD)

Impulsive Wave-5 of that Waves structure completed at 18604.50 on 19-10-2021 which begun through its impulsive Wave-1 from 7511.10 on 24-03-2020. Now "ABC" correction of this Waves structure(7511.10-18604.50) is in continuation with Double Zig-Zag pattern formation and no confirmation of its completion yet on EOD charts. Now Wave-A continuation with recent top formation at 17992.20 on 19-08-2022 after 2808 points gains. Positions of Short Term indicators are as follows:-

1- In Stochastic indicator %K(5) line has intersected %D(3) line downward and its both lines are falling within Over bought zone as well as showing negative divergence therefore strong indications of Short Term correction beginning.
2- In MACD indicator MACD line has intersected Average line downward and its both lines are falling in positive zone therefore indicating Short Term correction beginning signals.

Nifty-EOD Chart Analysis
(Fibonacci Retracement levels)
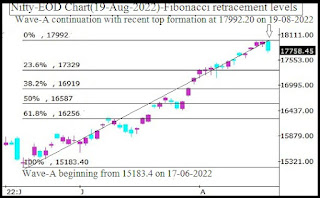
Nifty-EOD Chart (19-Aug-2022):-
Technical Patterns and Formations in EOD charts

1- Wave-A beginning from 15183.4 on 17-06-2022 
2- Wave-A continuation with recent top formation at 17992.20 on 19-08-2022 
3- Wave-A Fibonacci Retracement levels(15183.4-17992.20)
13.0%- 17627 
23.6%- 17329
27.0%- 17233
38.2%- 16919
50.0%- 16587
61.8%- 16256
70.7%- 16006
76.4%- 15846
78.6%- 15784
88.6%- 15503

Conclusions from EOD chart analysis
(Fibonacci retracement levels)

As strong signals of on going Wave-A correction emerged and it started also in previous week therefore above mentioned Fibonacci retracement levels should be firstly watched in the coming week/weeks for the life and length of expected correction.

Nifty-Last 4 Sessions
intraday charts analysis
Nifty-Intra Day Chart (Aug 16 to Aug 19,2022):-
Technical Patterns formation in last 4 Sessions intraday charts

1- Selling(Resistances) in last 4 Sessions are as follows:-
A- 17902-17979 
B- 17814-17839 
C- 17762-17834
2- Consolidation(Supports) in last 4 Sessions are as follows:-
A- 17765-17790
3- Last 4 Sessions actual trading between 17764-17992 

Conclusions from 4 Sessions
intra day chart analysis 

Although lower levels supports between 17765-17790 on 16-08-2022 but good selling at higher levels in both previous sessions and fresh selling within 16th Aug supports range(17765-17790) between 17762-17834 last Friday also therefore expected that down moves will be seen below last 4 sessions lowest in next week.

Nifty-Intra Day Chart Analysis
(19-Aug-2022)
Nifty-Intra Day Chart (19-Aug-2022):-
Technical Patterns formation in today intraday charts

1- Selling between 17934-17979 
2- Up moves in Bearish Rising Channel
3- Selling between 17762-17834
4- Whole day actual trading between 17711-17992

Conclusions from intra day chart analysis 

Although firstly up moves after positive opening but good selling developed in first one and half hour therefore down moves started which were in Bearish Rising Channel hence intraday recovery was not seen. As lower levels good selling in last 4 hours also therefore last Friday started correction is expected in the beginning of next week also.

Conclusions
(After putting all studies together)

All the trends are up. "ABC" correction continuation with Double Zig-Zag pattern formation. Now its Wave-A continuation and no confirmation of its completion yet but strong signals of its correction have emerged in previous week on intraday,EOD and Weekly charts in following manner:-

1- Good intraday selling patterns formations on last 2 sessions intraday charts.
2- Long "Breakaway Bearish EOD Candle" formation last Friday
3- "Gravestone Doji Bearish Weekly Candle" formation in previous week.
4- Short and Intermediate Term indicators have shown cotterction beginning strong signals.

Wave-A gained 2808 points in last 44 sessions and its correction has almost been started in previous week which will remain continued according to above mentioned Wave-A Fibonacci Retracement levels(15183.4-17992.20) therefore should be watched. Following supports should also be watched in the coming week/weeks for the next Short to Intermediate Term moves begining confirmations:-

1- 17598-17679
2- 17482-17543
3- 17366-17428
4- 17226-17293(Strong supports)
 Firstly down moves and finally today trading range will confirm next intraday decisive moves 
Nifty-Intra Day Chart Analysis & 
Market Outlook(19-08-2022)
Nifty-Intra Day Chart (18-Aug-2022):-
Technical Patterns formation in today intraday charts

1- Down moves after weaker opening
2- Selling between 17924-17955
3- Selling between 17902-17921
4- Up moves in Bearish Rising Channels
5- Whole day actual trading between 17853-17968

Conclusions from intra day chart analysis 

Although firstly down moves after weaker opening but today closing was at the top of on going rally after strong recovery from lower levels. As intraday selling between 17902-17955 and all the up moves were in Bearish Rising Channels also today therefore firstly down moves and intraday trading is expected within today trading range tomorrow. Follow up intraday posiitons formations and finally sustaining beyond today trading range(17853-17968) will confirm next intraday decisive moves which should be firstly watched tomorrow.
17909-17965 Will confirm next 
Short Term intraday moves 
Nifty-Intra Day Chart Analysis & 
Market Outlook(18-08-2022)
Nifty-Intra Day Chart (17-Aug-2022):-
Technical Patterns formation in today intraday charts

1- Up moves with downward corrections
2- Sideways trading between 17909-17943
3- Volatility in last hour between 17925-17965
4- Whole day actual trading between 17834-17965

Conclusions from intra day chart analysis 

As firstly up moves with downward corrections and after that sideways trading in Mid-session as well as clear intraday selling patterns were not seen therefore on going rally remained continued till last hour. 

Although today closing was at the top of on going rally but volatility in last hour between 17925-17965 and sideways trading also between 17909-17943 therefore 17909-17965 will be understood without one sided patterns formations and valid break out this range should be watched in the coming sessions for next Short Term intraday moves confirmations. 
 Firstly watch 17765-17839 for next decisive moves beginning confirmations
Nifty-Intra Day Chart Analysis & 
Market Outlook(17-08-2022)
Nifty-Intra Day Chart (16-Aug-2022):-
Technical Patterns formation in today intraday charts

1- Firstly up moves after gap up opening
2- Selling between 17814-17839
3- Sharp falls
4- Support between 17765-17790
5- Sharp up moves
6- Selling between 17822-17836
7- Whole day actual trading between 17765-17839

Conclusions from intra day chart analysis 

Although firstly up moves after gap up opening but selling developed at higher levels between 17814-17839 therefore sharp falls were seen after that. As supports at lower levels therefore Sharp up moves in last hour but again selling at higher levels.

As both higher levels selling at higher levels and lower levels supports also  between 17765-17839 therefore expected that Nifty will firstly trade within and near about this range tomorrow and finally sustaining beyond this range will confirm next decisive moves beginning which should be firstly watched tomorrow.
Firstly up moves but Short Term 
Correction is very much due
Technical Analysis,Research & 
Weekly Outlook(Aug 16 to Aug 19,2022)
Nifty-EOD Chart Analysis
(Stochastic & MACD)
Nifty-EOD Chart (12-Aug-2022):-
Technical Patterns and Formations in EOD charts

1- Wave-C completion at 15183.4 on 17-06-2022 and Wave-A beginning
2- Wave-A continuation with recent top formation at 17724.65 on 12-08-2022 & tested falling trendline from all time high.
4- Stochastic- %K(5) line has intersected %D(3) line upward and its both lines are rising within Over bought zone.
5- Stochastic:- %K(5)- 91.47 & %D(3)- 86.32.
6- Stochastic is showing negative divergence
7- In MACD- MACD line has intersected Average line upward and its both lines are rising in positive zone.
8- MACD(26,12)- 649.13 & EXP(9)- 570.84 & Divergence- 78.29

Conclusions from EOD chart analysis
(Stochastic & MACD)

Wave-A continuation with recent top formation at 17724.65 on 12-08-2022 and no indication of its completion yet on EOD charts. As Wave-A has tested falling trendline from all time high therefore sustaining it beyond in next week will confirm rally continuation or Short Term Correction beginning. Present positions of Short Term indicators are as follows:-

1- In Stochastic indicator %K(5) line has intersected %D(3) line upward and its both lines are slowly rising within Over bought zone as well as showing negative divergence therefore indicating strong signals of Short Term correction beginning.
2- In MACD indicator MACD line has intersected Average line upward and its both lines are rising in positive zone therefore suggesting upward trend continuation and showing up moves continuation signals.
 
Nifty-EOD Chart Analysis
(Averages)
Nifty-EOD Chart (12-Aug-2022):-
Technical Patterns and Formations in EOD charts

Averages:-

A- 5-Day SMA is today at  17562
B- 21-Day SMA is today at 16931 
C- 55-Day SMA is today at 16357
D- 100-Day SMA is today at 16611
E- 200-Day SMA is today at 16699
 
Conclusions from EOD chart analysis
(Averages)

Nifty has closed well above all the Short to Long Term Averages and shown too much strength during on going rally. As Nifty has traded more than 1000 above Long Term Trend decider 200-Day SMA last Friday therefore confirmation of sustaining above it and Long Term Trend turning up as well which is a strong indication of rally continuation also. 

Nifty-Intra Day Chart Analysis
(12-Aug-2022)
Nifty-Intra Day Chart (12-Aug-2022):-
Technical Patterns formation in today intraday charts

1- Sharp fall after flat opening
2- Whole day slow up moves
3- Whole day intraday corrections
4- Up moves with downward corrections
5- Down moves in Bullish Falling Channel
6- Sharp up moves in last half hour
7- Whole day actual trading between 17598-17724

Conclusions from intra day
chart analysis 

Although flat opening but sharp fall was seen after that. As whole day slow up moves with continuous intraday correcions also therefore up moves remained continue whole day.

As almost 60 points down moves in Bullish Falling Channel in last 2 hours which was a good sign of intraday consolidation last Friday therefore sharp up moves were seen in last half hour and confirming on going rally continuation in the beginning of next week also.

Conclusions
(After putting all studies together)

All the Trends are up. Impulsive Wave-1 of which Waves structure begun from 7511.10 on 24-03-2020 completed after 20 months at 18604.50 on 19-10-2021 and corrective Wave-A of "ABC" correction started with Double Zig-Zag pattern formation. Now on going "ABC" correction is more than 9 months old and its Wave-A continuation with  top formation at 17724.65 on 12-08-2022 after gaining 2541 points.

Although Long Term Trend turning up confirmation but Nifty has tested falling trendline therefore firstly sustaining above it also should be watched in next week for another storng signal of on going "ABC" correction completion. As Short & Intermediate Term indicators have turned Over bought and Short Term indicators are showing negative divergence also therefore showing signals of Short Term correction beginning which may begin any day.

Intraday chart of last Friday is showing good consolidation in last hours therefore firstly up moves will be seen in next week and let complete intraday selling patterns develop on intraday charts then Short Term correction will start which is very much due after 2541 points one sided rally and Over bought Short Term indicators.
 Watch 17632-17695 for next decisive intraday moves beginning confirmations
Nifty-Intra Day Chart Analysis & 
Market Outlook(12-08-2022)
Nifty-Intra Day Chart (11-Aug-2022):-
Technical Patterns formation in today intraday charts

1- Whole day Mixed Patterns formation between 17632-17695
2- Whole day actual trading between 17632-17719

Conclusions from intra day chart analysis 

As all the strong closing of US markets yesterday and Asian markets were blasting today morning as well as good intraday consolidation yesterday therefore huge gap up opening was seen today. 

Although today closing was little above today lowest after some higher levels selling but consolidation patterns were also seen therefore today trading will be understood with Mixed Patterns formation. Firstly follow up moves and after that sustaining  beyond 17632-17695 should be watched tomorrow for next decisive intraday moves beginning confirmations.
On going rally continuation
Nifty-Intra Day Chart Analysis & 
Market Outlook(11-08-2022)
Nifty-Intra Day Chart (10-Aug-2022):-
Technical Patterns formation in today intraday charts

1- More than 100 points fall after positive opening
2- More than 5 hours consolidation between 17482-17543
3- Whole day actual trading between 17443-17566

Conclusions from intra day
chart analysis 

As selling was seen between 17511-17548 yesterday therefore following conclusive line was told yesterday in "Watch 17511-17548 for rally continuation or correction beginning":-
Firstly sustaining beyond 17511-17548 should be watched tomorrow for rally continuation or emergence of Short to Intermediate Term correction beginning possibility. 

Although firstly more than 100 points fall after positive opening but after that more than 5 hours good consolidation between 17482-17543 today which was within and near about yesterday selling range(17511-17548) therefore on going rally continuation will be seen above today highest(17566) tomorrow.