Watch next Levels & Supports after 2808 points gaining 44 sessions old Wave-A rally correction beginning
Technical Analysis,Research & Weekly Outlook
(Aug 22 to Aug 26,2022)
Nifty-EOD Chart Analysis
(Stochastic & MACD)
Nifty-EOD Chart (19-Aug-2022):-
Technical Patterns and Formations in EOD charts
1- Impulsive Wave-5 completion after new life time top formation at 18604.50 on 19-10-2021 and corrective Wave-A of "ABC" correction beginning with Double Zig-Zag pattern formation
2- Wave-A completion at 16410.20 on 20-12-2021
3- Wave-B completion at 18351.00 on 18-01-2022
4- Wave-C bottom formation at 15671.5 on 08-03-2022
5- Wave-X completion at 18114.70 on 04-04-2022
6- Wave-A completion at 15735.80 on 12-05-2021
7- Wave-B completion at 16793.80 on 03-06-2022
8- Wave-C completion at 15183.4 on 17-06-2022 and Wave-A beginning
9- Wave-A continuation with recent top formation at 17992.20 on 19-08-2022
10- Stochastic- %K(5) line has intersected %D(3) line downward and its both lines are falling within Over Over bought zone.
11- Stochastic:- %K(5)- 77.78 & %D(3)- 89.89.
12- Stochastic is showing negative divergence
13- In MACD- MACD line has intersected Average line downward and its both lines are falling in positive zone.
14- MACD(26,12)- 570.18 & EXP(9)- 613.32 & Divergence- -43.14
Conclusions from EOD chart analysis
(Stochastic & MACD)
Impulsive Wave-5 of that Waves structure completed at 18604.50 on 19-10-2021 which begun through its impulsive Wave-1 from 7511.10 on 24-03-2020. Now "ABC" correction of this Waves structure(7511.10-18604.50) is in continuation with Double Zig-Zag pattern formation and no confirmation of its completion yet on EOD charts. Now Wave-A continuation with recent top formation at 17992.20 on 19-08-2022 after 2808 points gains. Positions of Short Term indicators are as follows:-
1- In Stochastic indicator %K(5) line has intersected %D(3) line downward and its both lines are falling within Over bought zone as well as showing negative divergence therefore strong indications of Short Term correction beginning.
2- In MACD indicator MACD line has intersected Average line downward and its both lines are falling in positive zone therefore indicating Short Term correction beginning signals.
Nifty-EOD Chart Analysis
(Fibonacci Retracement levels)
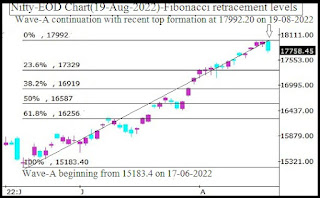
Nifty-EOD Chart (19-Aug-2022):-
Technical Patterns and Formations in EOD charts
1- Wave-A beginning from 15183.4 on 17-06-2022
2- Wave-A continuation with recent top formation at 17992.20 on 19-08-2022
3- Wave-A Fibonacci Retracement levels(15183.4-17992.20)
13.0%- 17627
23.6%- 17329
27.0%- 17233
38.2%- 16919
50.0%- 16587
61.8%- 16256
70.7%- 16006
76.4%- 15846
78.6%- 15784
88.6%- 15503
Conclusions from EOD chart analysis
(Fibonacci retracement levels)
As strong signals of on going Wave-A correction emerged and it started also in previous week therefore above mentioned Fibonacci retracement levels should be firstly watched in the coming week/weeks for the life and length of expected correction.
Nifty-Last 4 Sessions
intraday charts analysis
Nifty-Intra Day Chart (Aug 16 to Aug 19,2022):-
Technical Patterns formation in last 4 Sessions intraday charts
1- Selling(Resistances) in last 4 Sessions are as follows:-
A- 17902-17979
B- 17814-17839
C- 17762-17834
2- Consolidation(Supports) in last 4 Sessions are as follows:-
A- 17765-17790
3- Last 4 Sessions actual trading between 17764-17992
Conclusions from 4 Sessions
intra day chart analysis
Although lower levels supports between 17765-17790 on 16-08-2022 but good selling at higher levels in both previous sessions and fresh selling within 16th Aug supports range(17765-17790) between 17762-17834 last Friday also therefore expected that down moves will be seen below last 4 sessions lowest in next week.
Nifty-Intra Day Chart Analysis
(19-Aug-2022)
Nifty-Intra Day Chart (19-Aug-2022):-
Technical Patterns formation in today intraday charts
1- Selling between 17934-17979
2- Up moves in Bearish Rising Channel
3- Selling between 17762-17834
4- Whole day actual trading between 17711-17992
Conclusions from intra day chart analysis
Although firstly up moves after positive opening but good selling developed in first one and half hour therefore down moves started which were in Bearish Rising Channel hence intraday recovery was not seen. As lower levels good selling in last 4 hours also therefore last Friday started correction is expected in the beginning of next week also.
Conclusions
(After putting all studies together)
All the trends are up. "ABC" correction continuation with Double Zig-Zag pattern formation. Now its Wave-A continuation and no confirmation of its completion yet but strong signals of its correction have emerged in previous week on intraday,EOD and Weekly charts in following manner:-
1- Good intraday selling patterns formations on last 2 sessions intraday charts.
2- Long "Breakaway Bearish EOD Candle" formation last Friday
3- "Gravestone Doji Bearish Weekly Candle" formation in previous week.
4- Short and Intermediate Term indicators have shown cotterction beginning strong signals.
Wave-A gained 2808 points in last 44 sessions and its correction has almost been started in previous week which will remain continued according to above mentioned Wave-A Fibonacci Retracement levels(15183.4-17992.20) therefore should be watched. Following supports should also be watched in the coming week/weeks for the next Short to Intermediate Term moves begining confirmations:-
1- 17598-17679
2- 17482-17543
3- 17366-17428
4- 17226-17293(Strong supports)


