Crucial Technical Gaps break out is must for Next Big Trend
Nifty-EOD Chart (01-Oct-2013):-
 |
| Just click on chart for its enlarged view |
Technical Patterns and Formations in EOD charts
1- Bearish Head and Shoulders Pattern formations in 14 sessions
2- Neckline at 5810
Conclusions from EOD chart analysis
Bearish Head and Shoulders Pattern formations and its Neckline broken down on 30-09-2013 as well as last 2 sessions closing below it. Technically 3 days or minimum 3% closing below Neckline is required for valid break out confirmation of Neckline and it has not happened yet.
Nifty-EOD Chart (01-Oct-2013):-
 |
| Just click on chart for its enlarged view |
Technical Patterns and Formations in EOD charts
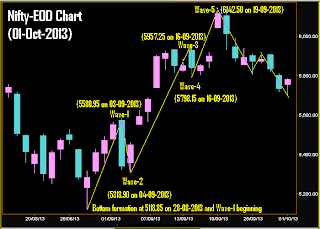
1- Bottom formation at 5118.85 on 28-08-2013 and Wave-1 beginning
2- Wave-1(5580.95 on 03-09-2013)
3- Wave-2(5318.90 on 04-09-2013)
4- Wave-3(5957.25 on 16-09-2013)
5- Wave-4(5798.15 on 16-09-2013)
6- Wave-5(6142.50 on 19-09-2013)
7- 'ABC' Correction continuation.
8- Wave-A(5811.10 on 25-09-2013)
9- Wave-B(5917.65 on 26-09-2013)
10- Wave-C bottom formation at 5700.95 on 01-10-2013.
11- Bullish Hammer formation on 01-10-2013.
Conclusions from EOD chart analysis
'ABC' Correction continuation and Wave-C bottom formation at 5700.95 on 01-10-2013 but same day good recovery after lower levels supports also even after negative news of 'Shut Down in USA'. As Bullish Hammer Candle formation on 01-10-2013 also therefore sustaining below Wave-C bottom is also required for further correction continuation.
Nifty-EOD Chart (01-Oct-2013):-
 |
| Just click on chart for its enlarged view |
Technical Patterns and Formations in EOD charts
1- 200 Day SMA at 5840
2- 200 Day EMA at 5751
Conclusions from EOD chart analysis
Long Term trend decider 200 Day SMA broken down but Long Term trend decider another average 200 Day EMA has not been broken yet and closing above it on 01-10-2013. Sustaining below 200 Day EMA is must and firstly required for deeper correction.
Nifty-EOD Chart (01-Oct-2013):-
 |
| Just click on chart for its enlarged view |
Technical Patterns and Formations in EOD charts
1- Gap resistance between 5810-5819
2- Gap support between 5689-5738
3- Gap support between 5460-5553
Conclusions from EOD chart analysis
Nifty closed at 5780.05 on 01-10-2013 which is between both next Gap support and next Gap resistance.
Nifty-Intra Day Chart (01-Oct-2013):-
 |
| Just click on chart for its enlarged view |
Technical Patterns and Formations in today intraday charts
1- Lower levels supports at 5701 after USA Shut Down news.
2- Whole day up moves in Bearish Rising Channel.
3- Whole day actual trading between 5701-5786
Conclusions from intra day chart analysis
Lower levels supports and panic bottom formation after USA Shut Down news and whole day up moves also but in Bearish Rising Channel therefore both Bullish and Bearish intraday formations and sustaining beyond today trading range(5701-5786) will be next trend first indication.
Conclusions (After Putting All Indicators Together)
As 'ABC' correction begun after completion of 5 waves of 16 sessions strong rally(5119-6142) therefore correction of whole rally is being seen. Good supports seen at lower levels on 01-10-2013 even after negative news of 'Shut Down in USA' and Bullish Hammer Candle formation also therefore it is correction completion first signal and sustaining below lowest of same day(5701) is must for correction continuation indication.
Nifty closed at 5780.05 on 01-10-2013 with both Bullish and Bearish intraday patterns formations and both deeper correction signals through Bearish Head and Shoulders Pattern and correction completion signal also on 01-10-2013 through lower levels good supports therefore next trend more preparations and formations are required for next trend formations and decisive moves.
Nifty previous closing is between next Gap resistance(5810-5819) and Gap support(5689-5738) and technical positions are mixed therefore Nifty will firstly trade and prepare for next trend and one side moves between 5689-5819 and valid break out of this range will decide:-
1- Rally after correction completion above 5819 or
2- Trend reversal below 5689.

