ॐ ह्रीं श्रीं लक्ष्मीभयो नमः॥


 This is the "Oldest & Only Website" of whole World
which is updating Nifty & Indian Stock Markets
"Daily and Weekly accurate Outlooks" 
with "Intraday Charts Analysis"for the 
last more than "14 years" means from "2010"
For its live Proofs just see "Archive"
in the "bottom of this Website".

Trading "calls" from our "Software" with more than "90% accuracy"

Watch 3 crucial levels one by one for next trend formations and that side decisive moves beginning confirmations
Technical Analysis,Research & Weekly Outlook
(Jan 06 to Jan 10,2025)
Nifty-EOD Chart Analysis
(Waves structure)
Nifty-EOD Chart (03-Jan-2025):-
Technical Patterns and Formations in EOD charts

1- Corrective Wave-C of previous Waves structure "ABC correction" completion at 15183.40 on 17-06-2022 and Impulsive Wave-1 of new Waves structure beginning.
2- Impulsive Wave-1 completion at 18887.60 on 01-12-2022.
3- Corrective Wave-2 completion at 16828.30 on 20-03-2023.
4- Impulsive Wave-(i) of Wave-3 completion at 20222.45 on 15-09-2023 and Wave-A of "ABC" correction beginning.
5- Wave-A of Wave-(ii) of Wave-3 completion at 19333.60 on 04-10-2023.
6- Wave-B of Wave-(ii) of Wave-3 completion at 19849.80 on 17-10-2023.  
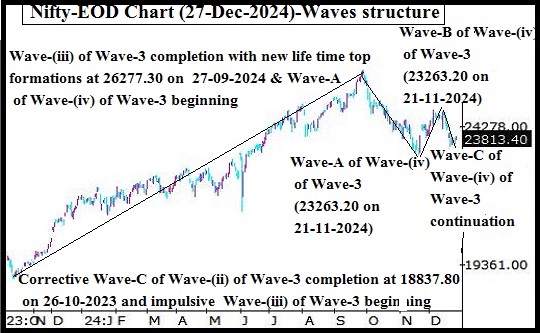
7- Corrective Wave-C of Wave-(ii) of Wave-3 completion at 18837.80 on 26-10-2023 and impulsive Wave-(iii) of Wave-3 beginning. 
6- Impulsive Wave-(iii) of Wave-3 completion with new life time top formations at 26277.30 on 27-09-2024 and Wave-A of Wave-(iv) of Wave-3 beginning.
9- Corrective Wave-A of Wave-(iv) of Wave-3 completion at 23263.20 on 21-11-2024.
10- Corrective Wave-B of Wave-(iv) of Wave-3 completion at 24857.80 on 05-12-2024.
11- Corrective Wave-C of Wave-(iv) of Wave-3 continuation with recent bottom formations at 23460.50 on 31-12-2024
12- Last 11 sessions trading between 23460.50-24226.70 after 277 points gap down opening on 19-12-2024.

Conclusions from EOD chart analysis
(Waves structure)

Corrective Wave-C of "ABC correction" of previous Waves structure completed at 15183.40 on 17-06-2022 and from this level impulsive Wave-1 of new Waves structure begun which completed at 18887.60 on 01-12-2022 and from this level corrective Wave-2 started which completed at 16828.30 on 20-03-2023 and impulsive Wave-3 begun from this level.

Impulsive Wave-(i) of Wave-3 completed at 20222.40 on 15-09-20235 and from this level corrective Wave-A of "ABC" correction of Wave-(ii) of Wave-3 started which completed at 19333.60 on 04-10-2023. Wave-B begun from this level which completed at 19849.80 on 17-10-2023 and Wave-C started which completed at 18837.80 on 26-10-2023. Impulsive Wave-(iii) of Wave-3 begun from this level which completed with new life time top formations at 26277.30 on 27-09-2024 and corrective Wave-A of Wave-(iv) of Wave-3 started from this level. 

Corrective Wave-A of Wave-(iv) of Wave-3 completed at 23263.20 on 21-11-2024 and Wave-B of Wave-(iv) of Wave-3 begun from this levels which completed at 24792.30 on 13-12-2024 and from this levels corrective Wave-C of Wave-(iv) of Wave-3 started which is now in continuation with recent bottom formations at 23460.50 on 31-12-2024 and no confirmation of its completion yet on EOD charts. Last 11 sessions trading was between 23460.50-24226.70 after 277 points gap down opening below 24150 on 19-12-2024 and this huge gap was filled up after 483 points strong rally and Nifty closed above 24150 at 24188.7 on 02-01-2025. As finally sustaining beyond last 11 sessions trading range(23460.50-24226.70) will confirm the lenth of on going corrective Wave-C of Wave-(iv) of Wave-3 and with it on going "ABC" correction also therefore should be watched for both these trends formation confirmations.  

Nifty-EOD Chart Analysis
(Stochastic & MACD)
Nifty-EOD Chart (03-Jan-2025):-
Technical Patterns and Formations in EOD charts

1- Last 11 sessions trading between 23460.50-24226.70 after 277 points gap down opening on 19-12-2024.
21- Stochastic- %K(5) line has intersected %D(3) line upward and its both lines are rising towards Over bought zone.
3- Stochastic:- %K(5)- 75.04 & %D(3)- 58.75.
4- In MACD- MACD line has intersected Average line downward and its both lines are falling in negative zone.
5- MACD(26,12)- -391.63 & EXP(9)- -290.57 & Divergence- -101.06

Conclusions from EOD chart analysis
(Stochastic & MACD)

Technical positions of Short Term indicators are as follows:-

1- As in Stochastic its %K(5) line has intersected %D(3) line upward and its both lines are rising towards Over bought zone and have not turned Over bought yet therefore it will be understood that this indicator is showing on going Short Term upward moves continuation possibility.
2- As in MACD its MACD line has intersected Average line downward and its both lines are falling in negative zone therefore it will be understood that this indicator is confirming Downward Trend formation and signalling more downward moves possibility.

Nifty-EOD Chart Analysis
(Averages)
Nifty-EOD Chart (03-Jan-2025):-
Technical Patterns and Formations in EOD charts

Averages:-

1- 5-Day SMA is today at 23845 
2- 21-Day SMA is today at 24170
3- 55-Day SMA is today at 24189
4- 100-Day SMA is today at 24626 
5- 200-Day SMA is today at 23899

Conclusions from EOD chart analysis
(Averages)

As Nifty is trading between and near about Intermediate Term Trend decider 55-Day SMA and Long Term Trend decider 200-Day SMA for the last 12 sessions as well as hovering around Short Term Trend decider 21-Day SMA for the last 2 sessions therefore it will be understood that now all the trends are at stake. Finally sustaining beyond 55-Day SMA or 200-Day SMA will confirm next Trend formations and resultant that side decisive moves will beginning therefore it should be watched for all the trends formation and that side decisive moves beginning confirmations.

Nifty-Intra Day Chart Analysis
(03-Jan-2025)
Nifty-Intra Day Chart (03-Jan-2025):-
Technical Patterns formation in today intraday charts

1- Whole day down moves in Bullish Falling Channels
2- Sharp up moves
3- 3 Times selling in sideways trading range.
4- Whole day actual trading between 23976-24196

Conclusions from intra day chart analysis 

Although flat opening but after that immediately downward moves started which remain continued till last minutes and Nifty closed 0.76% down also last Friday. As Whole day down moves were in Bullish Falling Channels which is a consolidation pattern also therefore once sharp up moves were seen but selling also developed 3 times in sideways trading range therefore whole day Mixed Patterns formations will be understood last Friday. 

As whole day down moves were in Bullish Falling Channels therefore up ward moves are expected within last Friday trading range but until complete consolidation patterns will not develop till then Nifty will not be able to move above last Friday highest and fresh selling will not mean correction continuation below last Friday lowest also therefore firstly sustaining beyond last Friday trading range should be watched in next week for 1st signal generation of next decisive moves beginning.

Conclusions
(After putting all studies together)

1- Long Term Trend is at stake.
2- Intermediate Term trend at stake.
3- Short Term Trend is at stake.

Now corrective Wave-C of Wave-(iv) of Wave-3 of that Waves structure is in continuation with recent bottom formations at 23460.50 on 31-12-2024 which begun through its impulsive Wave-1 from 15183.40 on 17-06-2022. As no confirmation of on going Wave- C completion yet therefore firstly sustaining beyond levels will be watched in the coming week/weeks for its continuation/completion confirmations.

Although Short Term indicator Stochastic is showing signals of some more upward moves possibility in next week but another Short Term indicator MACD is confirming Downward Trend formations therefore finally fresh downward moves beginning possibility can not be ruled out after some upward moves.

As last Friday intraday trading was also seen with Mixed Patterns formations between 23976-24196 therefore firstly sustaining it beyond should be watched for 1st signal of next trend formations. It should be kept ion mind that finally sustaining beyond last 11 sessions trading range(23460.50-24226.70) will confirm the length of on going corrective Wave-C therefore should be watched for the life of on going "ABC" correction also.

Averages are suggesting that firstly Nifty will move between 55-Day SMA(today at 24189) and 200-Day SMA(today at 23899) in the coming week therefore finally sustaining beyond these 2 SMAs should be watched in the coming week/weeks for on going correction completion confirmations through sustaining above 55-Day SMA and/or correction continuation confirmations through sustaining below 200-Day SMA. 

Firstly and finally sustaining beyond following 3 crucial levels should be watched one by one in the coming week/weeks for next trend formations and that side decisive moves beginning confirmations:-    

1- Last Friday trading range(23976-24196)
2- Last 11 sessions trading range(23461-24226)
3- 55-Day SMA(today at 24189)-200-Day SMA(today at 23899)
As out of station therefore unable 
to post today(03-01-2025) Outlook. 
Watch today highest amid 
upward moves expectations
Nifty-Intra Day Chart Analysis & 
Market Outlook(02-01-2025)
Nifty-Intra Day Chart (01-Jan-2025):-
Technical Patterns formation in today intraday charts

1- Consolidation between 23563-23658
2- Sharp up
3- 3 Times consolidation between 23690-23753
4- Whole day actual trading between 23563-23822

Conclusions from intra day chart analysis 

Although firstly down moves after negative opening and Nifty traded 82 points down also but good intraday consolidation was seen yesterday and fresh consolidation developed today also therefore after that sharp up moves seen. As 3 times consolidation between 23690-23753 in last hours also therefore upward moves are expected towards today highest and sustaining it beyond should also be firstly watched because Nifty could not sustain at higher levels also.
Upward moves expectations towards
 next resistances
Nifty-Intra Day Chart Analysis &
Market Outlook(01-01-2025)
Nifty-Intra Day Chart (31-Dec-2024):-
Technical Patterns formation in today intraday charts

1- Consolidation between 23461-23543
2- Up moves with downward corrections
3- Consolidation between 23578-23603
4- Consolidation between 23623-23657
5- Whole day actual trading between 23461-23689

Conclusions from intra day chart analysis 
Although all the US markets closed 0.97% to 1.56% down yesterday but Nifty traded with Mixed Patterns formation in last 2 hours between 23600-23701 yesterday therefore we told following conclusive line at 02:57 AM today in "Sustaining beyond 23600-23701 will confirm next intraday decisive moves beginning":-

As Mixed Patterns formation in last 2 hours between 23600-23701 therefore firstly sustaining beyond this range should be watched tomorrow for next intraday decisive moves beginning confirmations.

Sustaining beyond 23600-23701 was told and Nifty closed within this range at 23644.80 with today highest formations within this range at 23689.85.

As all the opened Asian markets were also trading in Red today morning therefore firstly downward moves were seen after weaker opening but lower levels consolidation developed and whole day consolidation patterns were also seen therefore upward moves are expected above today highest(23689) and towards next resistances(23846-23915) tomorrow.
Sustaining beyond 23600-23701 
will confirm next intraday 
decisive moves beginning
Nifty-Intra Day Chart Analysis &
Market Outlook(31-12-2024)
Nifty-Intra Day Chart (30-Dec-2024):-
Technical Patterns formation in today intraday charts

1- Down moves in Bullish Falling Channel
2- Up moves with downward corrections
3- 2 Times sharp up moves
4- Selling between 23846-23915
5- 2 Times sharp down moves
6- Mixed Patterns formation between 23600-23701 
7- Whole day actual trading between 23600-23915

Conclusions from intra day chart analysis 

Although firstly down moves after negative opening and Nifty traded 101 points down also but these down moves were in Bullish Falling Channel which is a consolidation pattern therefore upward moves started. As these up moves were with downward corrections which is also a consolidation pattern therefore 2 times sharp up moves were seen and Nifty recovered all intraday loss and traded 100 points up also. 

As higher levels selling developed and intraday selling was seen in previous sessions also above today highest therefore 2 times sharp down moves developed and Nifty closed near the lowest of the day after loosing all intraday gains. As  Mixed Patterns formation in last 2 hours between 23600-23701 therefore firstly sustaining beyond this range should be watched tomorrow for next intraday decisive moves beginning confirmations.
Long Term Trend is at stake & watch
 levels for its formation confirmations
Technical Analysis,Research & Weekly
 Outlook(Dec 30  to Jan 03,2025)
Nifty-EOD Chart Analysis
(Waves structure)
Nifty-EOD Chart (27-Dec-2024):-
Technical Patterns and Formations in EOD charts

1- Corrective Wave-C of Wave-(ii) of Wave-3 completion at 18837.80 on 26-10-2023 and impulsive Wave-(iii) of Wave-3 beginning. 
2- Impulsive Wave-(iii) of Wave-3 completion with new life time top formations at 26277.30 on 27-09-2024 and Corrective Wave-A of Wave-(iv) of Wave-3 of "ABC" correction beginning.
3- Corrective Wave-A of Wave-(iv) of Wave-3 completion at 23263.20 on 21-11-2024.
4- Corrective Wave-B of Wave-(iv) of Wave-3 completion at 24857.80 on 05-12-2024.
5- Corrective Wave-C of Wave-(iv) of Wave-3 continuation with recent bottom formations at 23537.30 on 20-12-2024
6- Last 6 Sessions trading between 23538-24065

Conclusions from EOD chart analysis
(Waves structure)

Impulsive Wave-(i) of Wave-3 completed at 20222.4 on 15-09-20235 and from this level "ABC" correction started. Corrective Wave-C of Wave-(ii) of Wave-3 completed at 18837.80 on 26-10-2023 and from this level impulsive Wave-(iii) of Wave-3 begun. 

Impulsive Wave-(iii) of Wave-3 completed after new life time top formations at 26277.30 on 27-09-2024 and corrective Wave-A of Wave-(iv)of Wave-3 begun which completed at 23263.20 on 21-11-2024. Corrective Wave-B of Wave-(iv) of Wave-3 started from this levels which completed at 24792.30 on 13-12-2024. From this levels corrective Wave-C of Wave-(iv) of Wave-3 begun which is now in continuation with recent bottom formations at 23537.30 on 20-12-2024. 

144 Points downward gap(24405-24149) formation on 19-12-2024 and after that long Black Candle formation was seen between 23538-24065 on 20-12-2024. Nifty traded all the 4 sessions of previous week within the range of this Candle and last 6 trading was also within the range of this Candle which means that Nifty is preparing for next bigger moves between 23538-24065 for the last 6 sessions. As 84 points gap(24065-24149) is still lying above the highest of last 6 sessions trading range(23538-24065) and this gap is immediate resistance of Nifty as well as until this gap will not be filled up through Nifty moving above 24149 till then any up move will not be seen therefore firstly filling of this gap should be watched for any upward move beginning confirmations.

Nifty-EOD Chart Analysis
(Stochastic & MACD)
Nifty-EOD Chart (27-Dec-2024):-
Technical Patterns and Formations in EOD charts

1- Stochastic- %K(5) line has intersected %D(3) line upward and its both lines are rising above Over sold zone.
2- Stochastic:- %K(5)- 38.24 & %D(3)- 27.02.
3- In MACD- MACD line has intersected Average line downward and its both lines are falling in positive and negative zone.
4- MACD(26,12)- -286.09 & EXP(9)- 122.38 & Divergence- -408.47

Conclusions from EOD chart analysis
(Stochastic & MACD)

Technical positions of Short Term indicators are as follows:-

1- As in Stochastic its %K(5) line has intersected %D(3) line upward and its both lines are rising above Over sold zone therefore it will be understood that this indicator is showing Short Term upward moves beginning stronger signals.
2- As in MACD its MACD line has intersected Average line downward and its both lines are falling in positive and negative zone therefore it will be understood that this indicator is signalling Downward Trend formation and suggesting more downward moves beginning possibility.

Nifty-EOD Chart Analysis
(Averages)
Nifty-EOD Chart (27-Dec-2024):-
Technical Patterns and Formations in EOD charts

Averages:-

1- 5-Day SMA is today at 23726 
2- 21-Day SMA is today at 24267
3- 55-Day SMA is today at 24296
4- 100-Day SMA is today at 24642
5- 200-Day SMA is today at 23861

Conclusions from EOD chart analysis
(Averages)

Nifty is trading between Intermediate Term Trend decider 55-Day SMA and Long Term Trend decider 200-Day SMA for the last more than 3 weeks. Firstly Nifty faced resistance after 8 sessions hovering around 55-Day SMA and from this level moved down 1100 points sharply as well as now hovering around 200-Day SMA for the last 6 sessions. Short and Intermediate Term Trends are down and now Long Term Trend is at stake as well as finally sustaining beyond its decider 200-Day SMA will confirm its next trend formations and resultant that sided bigger moves beginning which should be watched for its confirmations in the coming week/weeks.

Nifty-Intra Day Chart Analysis
(27-Dec-2024)
Nifty-Intra Day Chart (27-Dec-2024):-
Technical Patterns formation in today intraday charts

1- Consolidation between 23817-23856
2- Sharp up
3- Selling between 23906-23938
4- Down moves with upward corrections
5- Mixed Patterns formation in last 3 hours between 23803-23872
6- Whole day actual trading between 23801-23938

Conclusions from intra day chart analysis 

As firstly consolidation after positive opening in first hour therefore after that sharp up moves were seen but higher levels selling developed hence could not sustained at higher levels and downward moves begun. Although firstly down moves were with upward corrections which is a intraday selling pattern but lower levels Mixed Patterns formation were seen in last 3 hours between 23803-23872 therefore expected that Nifty will firstly trade and prepare for next decisive moves within and near about this trading range.As finally sustaining beyond this trading range will generate first strong signal of next immediate decisive moves beginning therefore it should be firstly watched in the next week for its confirmations.

Conclusions
(After putting all studies together)

1- Long Term Trend is at stake.
2- Intermediate Term trend is down.
3- Short Term Trend is down.

"ABC" correction which started after impulsive Wave-(iii) of Wave-3 completion with new life time top formations at 26277.30 is in continuation through its corrective Wave-C of Wave-(iv) of Wave-3 continuation with its recent bottom formations at 23537.30 on 20-12-2024 and no confirmation of its completion yet on EOD charts.

Although Short Term indicator Stochastic is signalling upward moves beginning possibility but another Short Term indicator MACD is showing downward Trend formation also therefore it will be concluded from Short Term indicators analysis that finally downward moves will be seen after some upward moves. 

As Nifty is trading for the last 6 sessions between 23538-24065 and hovered around Long Term Trend  decider 200-Day SMA(today at 23861) also during these moves therefore it is confirm that now Long Term Trend is at stake and finally valid break out direction of this last 6 sessions trading range will confirm Long Term Trend formations and one sided bigger moves beginning according to its break out direction. Immediate supports and resistances of Nifty are as follows which should be watched one by one for fresh signals of Long Term Trend formation confirmation:-

Next supports in last 6 sessions trading range

1- 23706-23773
2- 23648-23708
3- 23298-23337

Next resistances in last 6 sessions trading range

1- 23892-24065
2- Gap(24066-24149)
3- 24204-24266