ॐ ह्रीं श्रीं लक्ष्मीभयो नमः॥


 This is the "Oldest & Only Website" of whole World
which is updating Nifty & Indian Stock Markets
"Daily and Weekly accurate Outlooks" 
with "Intraday Charts Analysis"for the 
last more than "14 years" means from "2010"
For its live Proofs just see "Archive"
in the "bottom of this Website".

Trading "calls" from our "Software" with more than "90% accuracy"

Only Watch 4790-4907 Break out for Short Term / Intermediate Term Trend

Technical Analysis,Research & Weekly Outlook
 (May 21 to May 25,2012)

Nifty-EOD Chart (18-May-2012):-
Just click on chart for its enlarged view
Technical Patterns and Formations in EOD charts

1- Impulsive Wave-1 completion at 5629.95 on 22-02-2012.
2- Corrective Wave-2 continuation.
3- Breaking down confirmation after 9 sessions sustaining below Long Term Trend decider 200-Day SMA.
4- 61 Sessions correction in Falling Channel(Bullish Flag Formation)
5- Support at the bottom of Lower Falling Trend Line of  Falling Channel on 18-05-2012

Conclusions from EOD chart analysis 

All the trends are down and Indian markets are in the grip of Bears. Long Term Trend turning down confirmations through 9 sessions sustaing below 200-Day SMA during on going correction. Nifty got support at Lower Falling Trend Line of  Falling Channel on 18-05-2012 anf fast recovery seen also.

4 Supports & 4 Resistances in Last 10 Days

Nifty-Intra Day Chart (May 07 to May 18,2012):-
Just click on chart for its enlarged view
Technical Patterns and Formations in last 10 days intraday charts

4 Supports of last 10 sessions are as follows:-

S1- 4790-4807
S2- Double Bottom support at 4852.
S3- 4840-4860
S4- 4877-4907

4 Resistances of last 10 sessions are as follows:-

R1-4904-4922
R2-4936-4953
R3-5003-5036
R4-5065-5125

Conclusions from 10 days intra day chart analysis 

Strong recovery after gap down opening on 18-05-2012 as well as crossing all 3 previous supports because gap down opening was the result of Global markets crash. As market slipped after good selling therefore 4 resistances also developed in last 10 sessions.

Conclusions (After Putting All Studies Together)

All trends are down and Indian markets are in Bear phase and multiple resistances are at higher levels therefore complete consolidation is required for crossing and sustaining above resistances. Nifty has to face following resistances also after crossing above mentioned 4 resistances of on going 61 sessions correction:-

1- Resistance between 5190-5305
2- Resistance between 5318-5337
3- Resistance between 5357-5377
4- Resistance between 5418-5487
5- Resistance between 5588-5625

Fibonacci Retracement Levels of previous rally(4531-5629) are as follows:-

13.0%- 5486(Tested)
23.6%- 5369(Tested)
27.0%- 5332(Tested)
38.2%- 5209(Tested)
50.0%- 5080(Tested)
61.8%- 4950(Tested)
70.7%- 4852(Tested)
76.4%- 4790(Got support at 4788.95 on 18-05-2012)
78.6%- 4765
88.6%- 4656

76.4% Retracement completed on 18-05-2012 and after that sharp up move was also seen because Nifty got support also at Lower Falling Trend Line of  Falling Channel on 18-05-2012. Nifty got support between 4790-4907 in last 5 sessions therefore expected that Nifty will firstly trade between this range in the beginning of next week and sustaining above this range(4907) is must for any decisive up move. As all the trends are down therefore until Nifty will not sustain above 200-Day SMA till then only Pull Back rally will be considered. Breaking down below 4790 will be confirmations of fast down moves to test following supports;-

1- 4635-4663
2- 4602-4624
3- 4560-4590 

As last 5 sessions support range(4790-4907) is most crucial for deciding next short term/Intermediate term trend therefore firstly watch its break out for above mentioned next moves confirmations.

Indian Stock Markets Closing Reports(18-May-2012)

Main features of today trading are as follows

1- Benchmark Indices closed in Green.
2- Long White candle formation.
3- Strong recovery from lower levels after after gap down opening.

Ratios

Nifty Put Call Ratio: 0.95
Nifty P/E Ratio(18-May-2012): 16.85

Advances & Declines

BSE Advances : 1187
BSE Declines : 1536
NSE Advances :  603
NSE Declines :  819

Nifty Open Interest Changed Today

Nifty- 4700 CE(May)- +253650(+37.79%)
Nifty- 4700 PE(May)- +614800(+9.60%)

Nifty- 4800 CE(May)- +229550(+9.00%)
Nifty- 4800 PE(May)- +503200(+7.79%)

Nifty- 4900 CE(May)- -141500(-2.93%)
Nifty- 4900 PE(May)- -125200(-2.15%)

Nifty- 5000 CE(May)- +190250(+3.37%)
Nifty- 5000 PE(May)- +23400(0.65%)

Nifty- 5100 CE(May)- +515250(+7.94%)
Nifty- 5100 PE(May)- +-135100(-4.70%)

Closing 

Nifty- closed at 4,891.45(+21.25 Points & +0.44%)
Sensex- closed at 16,152.75(+82.27 Points & +0.51% )
CNX Midcap - closed at 6,867.30(-19.25 Points & -0.28%)
BSE Smallcap- closed at 6,255.42(-14.94 Points & -0.24%)

FII Trading Data in Derivatives Segment on 18-May-2012


FII & DII trading activity in Capital Market Segment on 18-May-2012

FII trading activity on NSE and BSE in Capital Julket Segment(In Rs. Crores)
CategoryDateBuy ValueSell ValueNet Value
FII18-May-20121672.691921.62-248.93

DII trading activity on NSE and BSE in Capital Julket Segment(In Rs. Crores)
CategoryDateBuy ValueSell ValueNet Value
DII18-May-20121021.59872.65148.94

Nifty Spot-Levels & Trading Strategy for 21-05-2012

Nifty Spot-Levels

R3 5056
R2 4982
R1 4936
Avg 4862
S1 4816
S2 4742
S3 4696

Nifty Spot-Trading Strategy

H6 5013     Trgt 2
H5 4985     Trgt 1
H4 4957     Long breakout
H3 4924     Go Short
H2 4913
H1 4902
L1 4880
L2 4869
L3 4858     Long
L4 4825     Short Breakout
L5 4796     Trgt 1
L6 4768     Trgt 2

Nifty(May Fut)-Levels & Trading Strategy for 21-05-2012

Nifty(May Fut)-Levels

R3 5079
R2 4992
R1 4940
Avg 4853
S1 4801
S2 4714
S3 4662

Nifty(May Fut)-Trading Strategy

H6 5030     Trgt 2
H5 4997     Trgt 1
H4 4964     Long breakout
H3 4926     Go Short
H2 4913
H1 4900
L1 4875
L2 4862
L3 4849     Long
L4 4811     Short Breakout
L5 4778     Trgt 1
L6 4745     Trgt 2

Bank Nifty(May Fut)-Levels & Trading Strategy for 21-05-2012

Bank Nifty(May Fut)-Levels

R3 9802
R2 9560
R1 9408
Avg 9166
S1 9014
S2 8772
S3 8620

Bank Nifty(May Fut)-Trading Strategy

H6 9664     Trgt 2
H5 9568     Trgt 1
H4 9472     Long breakout
H3 9364     Go Short
H2 9328
H1 9292
L1 9219
L2 9183
L3 9147    Long
L4 9039     Short Breakout
L5 8943     Trgt 1
L6 8847     Trgt 2

Nifty Spot-Weekly Levels & Trading Strategy(May 21 to May 25,2012)

Nifty Spot-Weekly Levels

R3 5138
R2 5047
R1 4969
Avg 4878
S1 4800
S2 4709
S3 4631

Nifty Spot-Weekly Trading Strategy 

H6 5063     Trgt 2
H5 5023     Trgt 1
H4 4983     Long breakout
H3 4937     Go Short
H2 4921
H1 4906
L1 4875
L2 4860
L3 4844    Long
L4 4798     Short Breakout
L5 4758     Trgt 1
L6 4718    Trgt 2

Bank Nifty Spot-Weekly Levels & Trading Strategy(May 21 to May 25,2012)

Bank Nifty Spot-Weekly Levels

R3 10045
R2 9772
R1 9541
Avg 9268
S1 9037
S2 8764
S3 8533

Bank Nifty Spot-Weekly Trading Strategy 

H6 9831     Trgt 2
H5 9709     Trgt 1
H4 9587     Long breakout
H3 9448     Go Short
H2 9402
H1 9356
L1 9263
L2 9217
L3 9171     Long
L4 9032     Short Breakout
L5 8910     Trgt 1
L6 8788     Trgt 2

Pre-Closing Outlook(18-05-2012)

Today gap down and most time negative zone trading was the sentimental impact of Global crashing sentiment but Strong SBI results boosted market mood and market sparked because it showed the strength of Indian Banking Industry.

Nifty got Double Bottom support at 4852 yesterday and closing above it will be seen today. Indian markets are in the grip of Bears and require complete consolidation for decisive up moves.

Firstly sustaining above 4852 and then forceful crossing of next crucial resistances will give decisive up moves confirmations.

Mid-session Outlook(18-05-2012)

All the Global markets crashing but fireowrks in Indian markets after good results of SBI. While European Banks are in deep trouble but on the other hand Indian Banks are prospering.

SBI boosted sentiment and sharp surge in Indian markets. Today up moves are strong and sustaining above crucial resistances will give decisive up moves confirmations.

Gap down amid Global markets crash

Nifty-Intra Day Chart (17-May-2012):-
Just click on chart for its enlarged view
Technical Patterns and Formations in today intraday charts

1- Selling between 4904-4922
2- Down moves in Falling Channel.
3- Double Bottom support at the lowest level.
4- Whole day trading between 4852-4922.

Conclusions from intra day chart analysis

When Indian markets were trading near the highs of the day and selling started to develop yesterday then it was immediately updated with next moves confirmation levels in Mid-session Outlook and following lines were told:-

1- minor selling formations also seen at higher levels today.
2- next moves confirmations is through sustaining above 4895/4882.

Firstly selling between 4904-4922 and after that down moves in Falling Channel(Bullish pattern) with intraday Double Bottom support at the lowest level of the day(4852) yesterday.

Pre-open Outlook(18-05-2012)

Although Double Bottom supports at lower levels were seen yesterday but most Asian markets are more than 2% down after 1.25% to 2% fall in all the US and European markets yesterday. Sentiment is highly depressed therefore negative zone trading and closing is expected after gap down opening today. 

Following supports of previous rally are only hopes for Bulls:-

1- 4810-4825
2- 4635-4663
3- 4602-4624
4- 4560-4590 

All trends are down and only Bounce Back or Pull Back Rally will be considered after support getting confirmations. Decisive up moves will be possible only after complete consolidations.

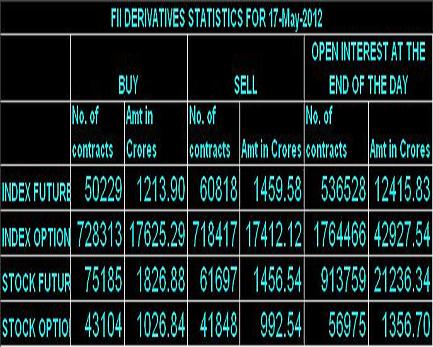
FII Trading Data in Derivatives Segment on 17-May-2012


FII & DII trading activity in Capital Market Segment on 17-May-2012

FII trading activity on NSE and BSE in Capital Julket Segment(In Rs. Crores)
CategoryDateBuy ValueSell ValueNet Value
FII17-May-20122289.292298.96-9.67

DII trading activity on NSE and BSE in Capital Julket Segment(In Rs. Crores)
CategoryDateBuy ValueSell ValueNet Value
DII17-May-2012955.33701.18254.15

Indian Stock Markets Closing Reports(17-May-2012)

Main features of today trading are as follows

1- Benchmark Indices closed in Green with marginal gains.
2- Most Indices closed with marginal gains or loss except FMCG closing after good intraday up moves.
3- Doji Candle formation.

Ratios

Nifty Put Call Ratio: 0.94
Nifty P/E Ratio(17-May-2012): 16.78

Advances & Declines

BSE Advances : 1335
BSE Declines : 1385
NSE Advances :  720
NSE Declines :  697

Nifty Open Interest Changed Today

Nifty- 4700 CE(May)- -13000(-1.90%)
Nifty- 4700 PE(May)- +342150(+5.65%)

Nifty- 4800 CE(May)- +423100(+19.88%)
Nifty- 4800 PE(May)- +5250(+0.08%)

Nifty- 4900 CE(May)- +300500(+6.63%)
Nifty- 4900 PE(May)- +193100(+3.31%)

Nifty- 5000 CE(May)- +99900(+1.77%)
Nifty- 5000 PE(May)- -308550(-7.89%)

Nifty- 5100 CE(May)- +208000(+3.31%)
Nifty- 5100 PE(May)- -107200(-3.59%)

Closing 

Nifty- closed at 4,870.20(+11.95 Points & +0.25%)
Sensex- closed at 16,070.48(+40.39 Points & +0.25% )
CNX Midcap - closed at 6,886.55(-15.50 Points & -0.22%)
BSE Smallcap- closed at 6,270.36(+5.41 Points & +0.09%)

Nifty Spot-Levels & Trading Strategy for 18-05-2012

Nifty Spot-Levels

R3 4983
R2 4952
R1 4911
Avg 4880
S1 4839
S2 4808
S3 4767

Nifty Spot-Trading Strategy

H6 4942     Trgt 2
H5 4925     Trgt 1
H4 4909     Long breakout
H3 4889     Go Short
H2 4883
H1 4876
L1 4863
L2 4856
L3 4850     Long
L4 4830     Short Breakout
L5 4814     Trgt 1
L6 4797     Trgt 2

Nifty(May Fut)-Levels & Trading Strategy for 18-05-2012

Nifty(May Fut)-Levels

R3 4979
R2 4945
R1 4898
Avg 4864
S1 4817
S2 4783
S3 4736

Nifty(May Fut)-Trading Strategy

H6 4933     Trgt 2
H5 4914     Trgt 1
H4 4896     Long breakout
H3 4874     Go Short
H2 4866
H1 4859
L1 4844
L2 4837
L3 4829     Long
L4 4807     Short Breakout
L5 4789     Trgt 1
L6 4770     Trgt 2

Bank Nifty(May Fut)-Levels & Trading Strategy for 18-05-2012

Bank Nifty(May Fut)-Levels

R3 9478
R2 9381
R1 9233
Avg 9136
S1 8988
S2 8891
S3 8743

Bank Nifty(May Fut)-Trading Strategy

H6 9331     Trgt 2
H5 9275     Trgt 1
H4 9219     Long breakout
H3 9152     Go Short
H2 9129
H1 9107
L1 9062
L2 9040
L3 9017     Long
L4 8950    Short Breakout
L5 8894     Trgt 1
L6 8838     Trgt 2

Pre-Closing Outlook(17-05-2012)


When Indian markets were trading near the highs of the day and selling started to develop then it was immediately updated with next moves confirmation levels in Mid-session Outlook and following lines were told:-

1- minor selling formations also seen at higher levels today..
2- next moves confirmations is through sustaining above 4895/4882.

Indian markets are in the hands of Bears and selling again seen at higher levels today as well as formations of new intraday lows also observed. Although whole day down moves in Falling Channel(Bullish pattern) but good selling at higher levels also therefore following levels will be firstly watched tomorrow for next moves confirmations:-

1- Sustaing above 4890 will be first upmove strong indication.
2- Sustaing above 4922 will be up moves confirmations.
3- Sustaining below 4838(yesterday lowest) will be deep down moves confirmation.

As Falling Channel(Bullish pattern) formation was seen above 4838 yesterday therefore sustaining below is must for more down moves confirmations.

Mid-session Outlook(17-05-2012)

That more than 1% up move and Pull Back rally is being seen today which was projected in both previous outlooks with the confirmation through sustaining above 4882.

Nifty is trading above 4882 since opening today but lot of consolidation is required for up moves because multiple resistances at higher levels and minor selling formations also seen at higher levels today..

Same view for next moves confirmations is through sustaining above 4895/4882.

4882 for deciding the fate of Pull Back rally

Nifty-Micro Analysis of Intra Day Chart For 17-05-2012

Nifty-Intra Day Chart (16-May-2012):-
Just click on chart for its enlarged view
Technical Patterns and Formations in today intraday charts

1- Down moves in Falling Channel.
2- Falling Channel upward Break out.
3- Last 2 hours volatility after Break out.
3- Whole day trading between 4838-4882

Conclusions from intra day chart analysis 

Intraday trading within 4838-4882 with Falling Channel formation and its upward break out was also seen. Falling channel and its upward break out are Bullish formations and sustaining above intraday high(4882) will be Pull Back rally confirmation.

As all trands are down therefore more consolidations are required for decisive up moves and follow up buying in the coming sessions will mean Pull Back rally after forceful break out or sustaining above 4882.

Firstly watch sustaining or closing beyond 4882 for next moves confirmations and it will decide the fate of Pull Back rally.

Indian Stock Markets Closing Reports(16-May-2012)

Main features of today trading are as follows

1- Red closing.
2- Whole day negative zone trading after gap down opening.
3- Benchmark Indives got intraday support at lower levels.

Ratios

Nifty Put Call Ratio:0.94
Nifty P/E Ratio(16-May-2012):16.74

Advances & Declines

BSE Advances :  920
BSE Declines : 1808
NSE Advances :  364
NSE Declines : 1055

Nifty Open Interest Changed Today

Nifty- 4700 CE(May)- +481950(+238.24%)
Nifty- 4700 PE(May)- +1098350(+22.14%)

Nifty- 4800 CE(May)- +1010450(+90.44%)
Nifty- 4800 PE(May)- -724900(-10.09%)

Nifty- 4900 CE(May)- +1706200(+57.14%)
Nifty- 4900 PE(May)- -721800(-10.40%)

Nifty- 5000 CE(May)- +690300(+13.96%)
Nifty- 5000 PE(May)- -869450(-18.18%)

Closing

Nifty- closed at 4,858.25(-84.55 Points & -1.71%)
Sensex- closed at 16,030.09(-298.16 Points & -1.83% )
CNX Midcap - closed at 6,902.05(-60.10 Points & -0.86%)
BSE Smallcap- closed at 6,264.95(-70.32 Points & -1.11%)

FII Trading Data in Derivatives Segment on 16-May-2012


FII & DII trading activity in Capital Market Segment on 16-May-2012

FII trading activity on NSE and BSE in Capital Julket Segment(In Rs. Crores)
CategoryDateBuy ValueSell ValueNet Value
FII16-May-20122239.472786.32-546.85

DII trading activity on NSE and BSE in Capital Julket Segment(In Rs. Crores)
CategoryDateBuy ValueSell ValueNet Value
DII16-May-20121415.781243.95171.83

Nifty Spot-Levels & Trading Strategy for 17-05-2012

Nifty Spot-Levels

R3 4926
R2 4904
R1 4881
Avg 4859
S1 4836
S2 4814
S3 4791

Nifty Spot-Trading Strategy

H6 4903     Trgt 2
H5 4892     Trgt 1
H4 4882     Long breakout
H3 4870     Go Short
H2 4866
H1 4862
L1 4853
L2 4849
L3 4845     Long
L4 4833     Short Breakout
L5 4823     Trgt 1
L6 4812     Trgt 2

Nifty(May Fut)-Levels & Trading Strategy for 17-05-2012

Nifty(May Fut)-Levels

R3 4931
R2 4904
R1 4880
Avg 4853
S1 4829
S2 4802
S3 4778

Nifty(May Fut)-Trading Strategy

H6 4907     Trgt 2
H5 4895     Trgt 1
H4 4884     Long breakout
H3 4870     Go Short
H2 4865
H1 4860
L1 4851
L2 4846
L3 4841     Long
L4 4827     Short Breakout
L5 4816     Trgt 1
L6 4804     Trgt 2

Bank Nifty(May Fut)-Levels & Trading Strategy for 17-05-2012

Bank Nifty(May Fut)-Levels

R3 9397
R2 9290
R1 9199
Avg 9092
S1 9001
S2 8894
S3 8803

Bank Nifty(May Fut)-Trading Strategy

H6 9308     Trgt 2
H5 9262     Trgt 1
H4 9216     Long breakout
H3 9162     Go Short
H2 9144
H1 9126
L1 9089
L2 9071
L3 9053     Long
L4 8999     Short Breakout
L5 8953     Trgt 1
L6 8907     Trgt 2

Mid-session Outlook(16-05-2012)

Nowadays complete manipulation through US futures. Yesterday Indian markets surged from intraday lower levels on the back of Dow'Futures more than 90 points up moves during Indian markets trading time but Dow Jones closed 63.35 down yesterday.

Indian markets complete reaction on Dow'Futures was updated yesterday in Pre-Closing Outlook(15-05-2012)  

Intraday selling was done yesterday through manipulated up moves in Us Futures and today gap down after most depressed global cues. All trends are down and all the patterns,strong supports and crucial levels have been broken down in on going correction.

Intraday trading within 4838-4881 with falling channel formation and its upward break out also seen today. Although falling channel and its upward break out is Bullish formations but sustaining above today trading range is must for Pull Back rally confirmations.

Pre-open Outlook(16-05-2012)

All the Asian markets are in down and Following Indices are in deep Red:-

1- HANG SENG INDEX- 508.40 (2.56%) Points down
2- Nikkei 225-  79.95 (0.90%) Points down
3- KOSPI Composite Index-  27.60 (1.45%) Points down
4- Singapur STI- 30.56 (1.06%) Points down
5- Taiwan Weighted-  63.12 (0.85%) Points down

Correction is on in Indian markets and after depressed sentiment negative zone trading will be seen weak opening.

Pre-Closing Outlook(15-05-2012)

Firstly intraday supports at lower levels and after that up moves to 4955 on the back of positive European markets and Dow'Futures more than 90 points up. As Dow'Futures slipped to +45 points and all the European markets moved down as well as traded flat therefore Nifty also moved down to 4919. Up moves repeation again in Dow'Futures and European markets therefore Indian markets also surged now.

Lower levels supports and today intraday patterns are showing consolidation formations therefore Pull Back rally possibility turning high now. As multiple resistances at higher level therefore consolidation is required at each step before any up move.

Sustaining above 5036 will be Pull Back Rally confirmation after lower levels supports and should be firstly watched.

Mid-session Outlook(15-05-2012)

Confirm intraday support at lower levels between 4896-4915 today but strong resistances at higher levels therefore consolidation is required before any up moves.

Sustaining above 5036 will be Pull Back Rally confirmation after lower levels supports and should be firstly watched.

Post-open Outlook(15-05-2012)

Crashing global markets reaction through weak opening but immediate recovery in first minute and trading near 4908. Intraday support seen below 4908 yesterday and hovering it around today despite depressing global markets.

Sustaining beyond 4908 should be firstly watched for next trend first signal.

Next moves generation through sustaining beyond 4908

Nifty-Micro Analysis of Intra Day Chart For 15-05-2012

Nifty-Intra Day Chart (14-May-2012):-
Just click on chart for its enlarged view
Technical Patterns and Formations in today intraday charts

1- Selling between 4945-4955
2- Support between 4877-4900 in last 3 hours.
3- Falling Channel formations with its break out in last 3 hours.
3- Whole day trading between 4877-4955.

Conclusions from intra day chart analysis 

Following lines were told in "Bull-Bear Match Final confirmation through Most Crucial 4908-4938" on 12-May-2012:-

"Bull-Bear Match Final confirmation will be through Most Crucial 4908-4938.Sustaining below 4908 will be Bear markets confirmation and sustaining above 4938 will be survival of up moves expectations"

Today closing is at 4907.80 and Bear markets confirmation is left through sustaining below 4908

Although markets slipped after Inflation upward data in March 2012 but could not crash after Dow' Futures is more than 100 points down and most of the European markets are 2% or more down trading. On the other hand Nifty got support also in last more than 3 hours supports between 4877-4900 and Falling Channel formations with its break out in last 3 hours.

As most of the oscillators in EOD charts are oversold therefore Pull Back rally may be seen any day and its its possibility is alive today after last 2 sessions supports at lower levels. All the trends are down and continuation of correction therefore more down moves possibilities can not be ruled out and following levels should be watched for next moves confirmations:-

1- Sustaining beyond 4908 because last 2 sessions supports below and above it.
2- Sustaining below 4877 will be sharp declines confirmations.
3- Sustaining above 5036 will be Pull Back Rally confirmation.

Firstly sustaining beyond 4908 should be watched for next moves confirmations with keeping in mind above mentioned possibilities. 

FII & DII trading activity in Capital Market Segment on 14-May-2012

FII trading activity on NSE and BSE in Capital Julket Segment(In Rs. Crores)
CategoryDateBuy ValueSell ValueNet Value
FII14-May-20122080.581725.48355.1

DII trading activity on NSE and BSE in Capital Julket Segment(In Rs. Crores)
CategoryDateBuy ValueSell ValueNet Value
DII14-May-2012850.14995.19-145.05

Indian Stock Markets Closing Reports(14-May-2012)

Main features of today trading are as follows

1- Benchmark Indices closed in Red.
2- Most Indices closed with minor gains or loss after intraday support at lower levels.
3- Black Candle formation.

Ratios

Nifty Put Call Ratio: 1.03
Nifty P/E Ratio(14-May-2012): 16.95

Advances & Declines

BSE Advances : 1044
BSE Declines : 1668
NSE Advances :  433
NSE Declines :  990

Nifty Open Interest Changed Today

Nifty- 4800 CE(May)- +239150(+30.81%)
Nifty- 4800 PE(May)- +485900(+7.47%)

Nifty- 4900 CE(May)- +452600(+16.37%)
Nifty- 4900 PE(May)- +245200(+3.60%)

Nifty- 5000 CE(May)- +588750(+13.19%)
Nifty- 5000 PE(May)- -150000(-2.79%)

Nifty- 5100 CE(May)- +288300(+5.26%)
Nifty- 5100 PE(May)- +231850(+6.45%)

Closing 

Nifty- closed at 4,907.80(-21.10 Points & -0.43%)
Sensex- closed at 16,215.84(-77.14 Points & -0.47% )
CNX Midcap - closed at 6,922.65(-63.10 Points & -0.90%)
BSE Smallcap- closed at 6,314.57(-80.81 Points & -1.26%)

Nifty Spot-Levels & Trading Strategy for 15-05-2012

Nifty Spot-Levels

R3 5034
R2 4995
R1 4951
Avg 4912
S1 4868
S2 4829
S3 4785

Nifty Spot-Trading Strategy

H6 4990     Trgt 2
H5 4971     Trgt 1
H4 4952     Long breakout
H3 4929     Go Short
H2 4922
H1 4914
L1 4899
L2 4891
L3 4884     Long
L4 4861     Short Breakout
L5 4842     Trgt 1
L6 4823     Trgt 2

Nifty(May Fut)-Levels & Trading Strategy for 15-05-2012

Nifty(May Fut)-Levels

R3 5022
R2 4986
R1 4937
Avg 4901
S1 4852
S2 4816
S3 4767

Nifty(May Fut)-Trading Strategy

H6 4973     Trgt 2
H5 4954     Trgt 1
H4 4934     Long breakout
H3 4911     Go Short
H2 4903
H1 4895
L1 4880
L2 4872
L3 4864     Long
L4 4841     Short Breakout
L5 4821     Trgt 1
L6 4802     Trgt 2

Bank Nifty(May Fut)-Levels & Trading Strategy for 15-05-2012

Bank Nifty(May Fut)-Levels

R3 9692
R2 9571
R1 9374
Avg 9253
S1 9056
S2 8935
S3 8738

Bank Nifty(May Fut)-Trading Strategy

H6 9497     Trgt 2
H5 9425     Trgt 1
H4 9352     Long breakout
H3 9265     Go Short
H2 9236
H1 9207
L1 9148
L2 9119
L3 9090     Long
L4 9003     Short Breakout
L5 8930     Trgt 1
L6 8858     Trgt 2

Pre-Closing Outlook(14-05-2012)

Dow' Futures is more than 100 points down and most of the European markets are 2% or more down but Indian markets are less than 1% down today. Correction is on and selling seen at higher levels between 4945-4955 today but supports also seen at lower levels today despite surge in Monthly Inflation and above mentioned negative Global markets moves also. 

Nifty got supports at lower levels 0n 11-05-2012 and today therefore sustaining below today lower levels will be firstly watched for any down move confirmations.

NSE Systems Technical Fault

Nifty Futures rates are not updating from 01:36 PM today.

Mid-session Outlook-3(14-05-2012)

April inflation at 7.23% vs 6.89% in March

Inflation upward trend triggered down moves in Indian markets and Nifty slipped below 4908. As intraday selling formation confirmation between 4945-4955 therefore sustaining below 4908 will mean crashing like situation possibility.

Mid-session Outlook-2(14-05-2012)

Intraday selling confirmation between 4945-4955 today.

Mid-session Outlook(14-05-2012)

Technical positions of 11-05-2012 are as follows:-

1- Supports between 4908-4938
2- Selling between 4955-4975

Today first 2 hours trading range is 4937-4954 and it will be clear from intraday charts that it is least trading zone of 11-05-2012. Market is firstly preparing for next moves within 4937-4954 and sustaining beyond 4908-4975 will be result of positions formation firstly within 4937-4954 and afteward within 4908-4975. 

Next trend confirmation will be sustaining beyond 4908-4975 and should be firstly watched.