Whatsoever happen today all that was clearly projected in following lines on 03-03-2012:-
"negative results for Congress will certainly badly hamper sentiment therefore coming sessions may be highly volatile and follow up selling after any nervous news may result slipping below 5340/5268 also"
Crucial Supports in Assembly Election Results Week
Just click above topic link for verification of our above projection and following most crucial points also:-
1- All the supports of Dec 2011 rally.
2- Long tern trend deciding levels
3- Importance of next support range 5120-5190.
4- For most crucial levels within 5120-5190.
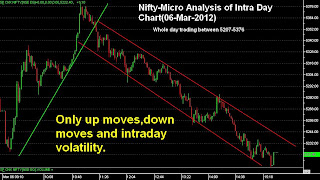
Nifty-Intra Day Chart(06-Mar-2012):-
Technical Patterns and Formations in today intraday charts
1- Only up moves,down moves and intraday volatility.
2- Closing at the lowest of the day.
3- Whole day trading between 5207-5376.
Main features of today trading:-
1- Highy volatile markets after gap down opening.
2- Sharp surgees and declines according to Congress prospects after Assembly Elections Results declarations.
3- Reflection of Congress dismal performance through closing at the lowest of the day.
4- Intermediate term trend turning down confirmations through sustaining below 5340.
5- Breaking down of 7 days sessions range.
More down moves are expected in the coming sessions and those supports ranges which has already been updated on on 03-03-2012.
"negative results for Congress will certainly badly hamper sentiment therefore coming sessions may be highly volatile and follow up selling after any nervous news may result slipping below 5340/5268 also"
Crucial Supports in Assembly Election Results Week
Just click above topic link for verification of our above projection and following most crucial points also:-
1- All the supports of Dec 2011 rally.
2- Long tern trend deciding levels
3- Importance of next support range 5120-5190.
4- For most crucial levels within 5120-5190.
Nifty-Intra Day Chart(06-Mar-2012):-
 |
| Just click on chart for its enlarged view |
1- Only up moves,down moves and intraday volatility.
2- Closing at the lowest of the day.
3- Whole day trading between 5207-5376.
Conclusions
Main features of today trading:-
1- Highy volatile markets after gap down opening.
2- Sharp surgees and declines according to Congress prospects after Assembly Elections Results declarations.
3- Reflection of Congress dismal performance through closing at the lowest of the day.
4- Intermediate term trend turning down confirmations through sustaining below 5340.
5- Breaking down of 7 days sessions range.
More down moves are expected in the coming sessions and those supports ranges which has already been updated on on 03-03-2012.

