

ॐ ह्रीं श्रीं लक्ष्मीभयो नमः॥

FII & DII trading activity in Capital Market Segment on 10-Jan-2012
| ||||||||||||||||
| ||||||||||||||||
Indian Stock Markets Closing Reports(10-Jan-2012)
1- All the Indices closed in Green with good gains.
2- Long White Candle.
3- Market showed good strength and Nifty crossed 1st strong resistance.
Ratios
Nifty Put Call Ratio: 1.02
Nifty P/E Ratio(10-Jan-2012): 17.56
Advances & Declines
BSE Advances : 2149
BSE Declines : 687
NSE Advances : 1229
NSE Declines : 237
Nifty Open Interest Changed Today
Nifty- 4700 CE(Jan)- -411750(-13.43%)
Nifty- 4700 PE(Jan)- +1292350(+24.35%)
Nifty- 4800 CE(Jan)- -524350(-11.97%)
Nifty- 4800 PE(Jan)- +2453900(+113.80%)
Nifty- 4900 CE(Jan)- +238850(+4.80%)
Nifty- 4900 PE(Jan)- +740950(+64.12%)
Closing
Nifty- closed at 4,849.55(+106.75 Points & +2.25%)
Sensex- closed at 16,165.09(+350.37 Points & +2.22% )
CNX Midcap - closed at 6,467.55(+151.50 Points & +2.40%)
BSE Smallcap- closed at 5,996.48(+153.95 Points & +2.63%)
Nifty Spot-Levels & Trading Strategy for 11-01-2012
R3 4967
R2 4911
R1 4880
Avg 4824
S1 4793
S2 4737
S3 4706
Nifty Spot-Trading Strategy
H6 4937 Trgt 2
H5 4917 Trgt 1
H4 4896 Long breakout
H3 4872 Go Short
H2 4864
H1 4856
L1 4841
L2 4833
L3 4825 Long
L4 4801 Short Breakout
L5 4780 Trgt 1
L6 4760 Trgt 2
Nifty(Jan Fut)-Levels & Trading Strategy for 11-01-2012
R3 5001
R2 4938
R1 4904
Avg 4841
S1 4807
S2 4744
S3 4710
Nifty(Jan Fut)-Trading Strategy
H6 4968 Trgt 2
H5 4946 Trgt 1
H4 4923 Long breakout
H3 4896 Go Short
H2 4887
H1 4878
L1 4861
L2 4852
L3 4843 Long
L4 4816 Short Breakout
L5 4793 Trgt 1
L6 4771 Trgt 2
Bank Nifty(Jan Fut)-Levels & Trading Strategy for 11-01-2012
R3 9124
R2 8949
R1 8854
Avg 8679
S1 8584
S2 8409
S3 8314
Bank Nifty(Jan Fut)-Trading Strategy
H6 9037 Trgt 2
H5 8972 Trgt 1
H4 8907 Long breakout
H3 8833 Go Short
H2 8808
H1 8783
L1 8734
L2 8709
L3 8684 Long
L4 8610 Short Breakout
L5 8545 Trgt 1
L6 8480 Trgt 2
Pre-Closing Outlook(10-01-2012)
Following line was told in Mid-session Outlook today
finally up moves above 4838 are expected
Nifty is trading above 4840 for the last half hour. Rally is on after 5 days consolidation and its continuation is expected in the coming sessions also.
finally up moves above 4838 are expected
Nifty is trading above 4840 for the last half hour. Rally is on after 5 days consolidation and its continuation is expected in the coming sessions also.
Mid-session Outlook(10-01-2012)
Nifty is trading between 1st resistance range(4780-4838) since opening and trading between 4815-4832 with mixed intraday patterns for the last 2 hours today.
As trading within crucial resistance range therefore more consolidation is required for next upmoves and 4815-4832 will be watched for next moves confirmations. Although finally up moves above 4838 are expected but mentioned range will also be watched for confirmations.
As trading within crucial resistance range therefore more consolidation is required for next upmoves and 4815-4832 will be watched for next moves confirmations. Although finally up moves above 4838 are expected but mentioned range will also be watched for confirmations.
Post-open Outlook(10-01-2012)
Anyone can verify from our previous outlooks that we told only and only for up moves and topic of weekly was:-
Bulls Will Welcome In Next Week
5 Sessions range forceful break out today and continuation of rally is expected.
Bulls Will Welcome In Next Week
5 Sessions range forceful break out today and continuation of rally is expected.
Accumulation of Exlosives between 4687-4794 to celetrate 2012
Technical Analysis,Researches & Market Outlook
(10-01-2012)
(10-01-2012)
Nifty-Intra Day Chart(09-Jan-2011):-
 |
| Just click on chart for its enlarged view |
1- Up moves in Rising trendline with support after every fall.
2- Rising trendline broken down in last hours.
3- Bullish Hammer Candle formation.
4- Whole day trading between 4698-4758
Conclusions from intra day chart analysis
Consolidation indications from intraday patterns and Bullish Hammer candle formation also today therefore continuation of previous month begun rally hopes are alive despite most of the time negative zone trading today.
Nifty-EOD Chart(09-Jan-2011):-
 |
| Just click on chart for its enlarged view |
1- Sub Wave 1(upmove) begun at 4532 on 20-12-2011
2- Sub Wave 1(upmove) completed at 4800 on 27-12-2011 and Sub Wave 2(its correction) begun.
3- Sub Wave 2(corrective) completed at 4589 on 02-01-2012 and Sub Wave 3(upmove) begun.
4- 6 sessions trading betwwn 27 Sessions trading range 4687-4794
Conclusions from EOD chart analysis
Exlplosives are being accumulated between 4687-4794 and blasting moves will be seen after forceful break out or sustaining beyond this range. As both selling at higher levels and buying at lower levels therefore more preparaion is required for decisive break out and expected that Nifty will firstly trade within mentioned range.
As more consolidation signals and intraday patterns within mentioned range(4687-4794) therefore its upward break out is expected in the coming sessions and for precaution sustaining beyond this range will be watched for confirmations.
Crucial levels have already been updated in Pre-Closing Outlook(09-01-2012) therefore not being repeated.

FII & DII trading activity in Capital Market Segment on 09-Jan-2012
| ||||||||||||||||
| ||||||||||||||||
Indian Stock Markets Closing Reports(09-Jan-2012)
1- Benchmark Indices closed in Red but Mid Cap and Small cap closed in Green with sullicient gains.
2- Although Benckmark Indices traded most time in Red but Small cap Index traded most time in Green and closed 1.40% positive.
3- Doji Candle Formation.
Ratios
Nifty Put Call Ratio: 0.86
Nifty P/E Ratio(09-Jan-2012): 17.18
Advances & Declines
BSE Advances : 1640
BSE Declines : 1090
NSE Advances : 925
NSE Declines : 520
Nifty Open Interest Changed Today
Nifty- 4600 CE(Jan)- +8250(+0.56%)
Nifty- 4600 PE(Jan)- +373400(+6.80%)
Nifty- 4700 CE(Jan)- +228550(+7.80%)
Nifty- 4700 PE(Jan)- +445500(+8.70%)
Nifty- 4800 CE(Jan)- +503150(+12.71%)
Nifty- 4800 PE(Jan)- +138650(+6.48%)
Closing
Nifty- closed at 4,742.80(+/-4.10 Points & -0.09%)
Sensex- closed at 15,814.72(-34.08 Points & -0.22%)
CNX Midcap - closed at 6,316.05(+40.80 Points & +0.65%)
BSE Smallcap- closed at 5,842.53(+80.92 Points & +1.40%)
Nifty Spot-Levels & Trading Strategy for 10-01-2012
R3 4831
R2 4794
R1 4768
Avg 4731
S1 4705
S2 4668
S3 4642
Nifty Spot-Trading Strategy
H6 4805 Trgt 2
H5 4791 Trgt 1
H4 4776 Long breakout
H3 4759 Go Short
H2 4753
H1 4747
L1 4736
L2 4730
L3 4724 Long
L4 4707 Short Breakout
L5 4692 Trgt 1
L6 4678 Trgt 2
Nifty(Jan Fut)-Levels & Trading Strategy for 10-01-2012
R3 4857
R2 4817
R1 4784
Avg 4744
S1 4711
S2 4671
S3 4638
Nifty(Jan Fut)-Trading Strategy
H6 4824 Trgt 2
H5 4807 Trgt 1
H4 4791 Long breakout
H3 4771 Go Short
H2 4764
H1 4757
L1 4744
L2 4737
L3 4730 Long
L4 4710 Short Breakout
L5 4694 Trgt 1
L6 4677 Trgt 2
Bank Nifty(Jan Fut)-Levels & Trading Strategy for 10-01-2012
R3 8756
R2 8636
R1 8541
Avg 8421
S1 8326
S2 8206
S3 8111
Bank Nifty(Jan Fut)-Trading Strategy
H6 8664 Trgt 2
H5 8614 Trgt 1
H4 8564 Long breakout
H3 8505 Go Short
H2 8485
H1 8465
L1 8426
L2 8406
L3 8386 Long
L4 8327 Short Breakout
L5 8277 Trgt 1
L6 8227 Trgt 2
Pre-Closing Outlook(09-01-2012)
Indian markets are locked between supports and resistances therefore following supports and resistances were updated in previous outlooks:-
1- Support-1- 4688-4720
2- Support-2- 4590-4625
3- Resistance-1- 4750-4780
4- Resistance-2- 4765-4778
5- Resistance-3- 4780-4838
Market will firstly prepare for next moves and take positions between 4688-4780 and slipping below 4688 will be a big blow. Crossing 4780 and sustaining above 4838 will be real sentiment boosting and confidence building for Indian markets.
Although Indian markets traded in Red whole day today but intraday patterns are showing consolidation signals therefore fresh upmoves hopes are alive despite Negative zone trading at this moment today.
Mid-session Outlook(09-01-2012)
Nifty got support between 4688-4720 and after that 75 points sharp spike in 15 minutes was seen through rumour of Reliance brothers joint projects on 06-01-2012 but market lost all the gains therefore selling same day on the back of rumour mongering can not be ruled out.
As Nifty is again trading between mentioned support range(4688-4720) since opening today therefore sustaining it beyond should be firstly watched for next moves confirmations as well as next support/resistance beyond this range are as follows which may be tested after the break out of this range;-
1- Next Support;- 4590-4625
2- Next Resistance;- 4750-4780
Nifty moved above 4720 and it is confirmation of good support between 4688-4720 ,sustaining above 4720 will be confirmation of strength and fresh upmoves also.
Post-open Outlook(09-01-2012)
Following 2 negative factors have triggered down moves today morning;-
1- Sharp 75 points surge in 15 minutes on 06-01-2012 was manipulated through rumour of Reliance brothers joint projects.
2- All the Asian markets in Red since opening therefore sentiment is weak today morning.
First support between 4688-4720 and Nifty consolidated between this range last Friday as well as trading between this range after weak opening today and this range will be firstly watched for next moves confirmations.
Bulls Will Welcome In Next Week
Technical Analysis,Research & Weekly Outlook
(Jan 07 to Jan 13,2012)
Following technical points are very well established:-
All trends are down after 14 months falling trendline correction and following 2 formations after huge gap down opening on 05-08-2011 at the bottom of correction:-
1- 103 sessions sideways moment between 4720-5229 and intact at present.
2- As 103 sessions range once broken out and several times broken down therefore trend reversal Broadening Pattern formation at the bottom of 14 months correction and it is also still intact.
3- As Nifty slipped below 4693 therefore 36 months waves structure was also at stake in previous weeks but it is also safe at present and impulsive Wave 5 possibility is still alive after completion of Wave 4.
Sustaining beyond 103 sessions trading range(4720-5229) will mean huge moves towards breaking out direction. As Nifty closed within range therefore Indian markets are poised for any side break out. Now we shall try to explore the break out direction of mentioned range and understand immediate next moves through analysis of following charts;-.
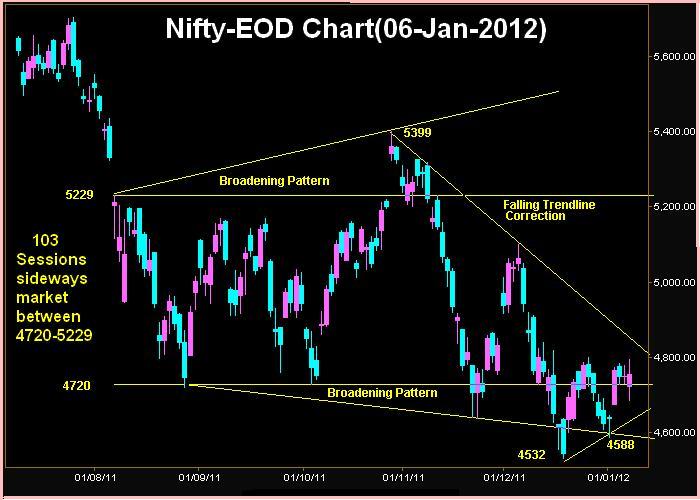
Nifty-EOD Chart(06-Jan-2012):-
 |
| Just click on chart for its enlarged view |
1- Trend Reversal Broadening Pattern at the bottom of 14 months correction is intact.
2- 103 Sessions sideways market between 4720-5229 is intact.
3- Falling Trendline Correction from the top of Broadening Pattern(5399)
4- Very short term up move from 4532 which got support at 4588 as well as higher bottom confirmation.
Conclusions from EOD chart analysis
Both above patterns(1st & 2nd) broken down during the last half of previous month but again all are intact after the beginning of 2012. Very short term upmove begun from 4532 and it got higher bottom support on the first day of 2012 at 4588 therefore impulsive Wave 5 commencement possibility is also still alive after completion of Wave 4.
Last 3 sessions firstly sideways and then volatile market between 4688-4788 therefore too much has been riped between this 100 points trading range and its break out will give big moves to Indian markets therefore technical positions within this range will be understood because only that will give first indication of next trend:-
Nifty-Micro Analysis of Intra Day Chart(06-Jan-2011):-
 |
| Just click on chart for its enlarged view |
1- Support between 4688-4720
2- Sharp 75 points surge in 15 minutes
3- Consolidation patterns between 4738-4758 in last 40 minutes
4- Whole day trading between 4687-4795
Conclusions from intra day chart analysis(06-Jan-2011)
Confirm support at lower levels and also consolidation patterns in last 40 minutes therefore today begun upmoves from intraday lower levels will remain continued in the coming sessions.
Nifty-Micro Analysis of Intra Day Chart(05-Jan-2011):-
 |
| Just click on chart for its enlarged view |
1- Selling between 4765-4778.
2- Rising channel broken down.
3- Support between 4731-4742
4- Whole day trading between 4731-4779
Conclusions from intra day chart analysis(05-Jan-2011)
Good selling between 4765-4778 therefore fresh consolidation is required for any upmoves as well as sustaining above 4778.
Nifty-Micro Analysis of Intra Day Chart(04-Jan-2011):

1- Consolidation between 4735-4756
2- Rounding bottom support formation
3- Whole day consolidation patterns only
4- Whole day trading between 4730-4780
Conclusions from intra day chart analysis(04-Jan-2011)
Good support at lower levels and whole day consolidation pattern formations also therefore rally continuation expectation emerged from intraday charts formations.
Conclusions (After Putting All Studies Together)
Firstly 2008 sharp fall and after that more than 4 months range bound market was seen before 3600 Nifty points rally. In the same manner Now 103 sessions range bound(4720-5229) market after Diwali-2010 sharp fall therefore susch huge upmoves possibility is very much alive after this range break out. As trend reversal Broadening Pattern also developed in thelast 103 sessions therefore 14 months down trend reversal and fresh rally possibility is very much high after 103 sessions range upward break out.
December 2011 was 13th month of Long term correction correction and on going upmove begun on 21-12-2011 from 4532. As 13 is a Fibonacci number therefore correction completion as well as trend reversal possibility in 13th corrective month is very much alive.
Although selling seen at higher levels but good consolidation at lower levels also felt in last 3 sessions as well as more consolidation patterns formations therefore expected that Nifty will finally sustain above last 3 sessions range(4687-4795).
Both intraday and EOD Charts are suggesting for more up moves after very short term correction completion in last 3 sessions. Although up moves may be slow because of following 8 resistances but expected that consolidation process and rally continuation will progress simultaneously in the coming week.
1- 4780-4838
2- 4880-4905
3- 4950-4980
4- 5070-5098
5- 5130-5225
6- 5260-5310
7- 5240-5265
8- 5340-5375

Subscribe to:
Posts (Atom)