

Sustaining beyond 11541-11617
will generate first signal
Nifty-Intra Day Chart Analysis &
Market Outlook(28-08-2020)
Nifty-Intra Day Chart (27-Aug-2020):-
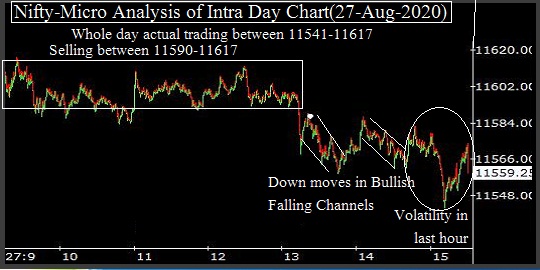
Technical Patterns formation in today intraday charts
1- Selling between 11590-11617
2- Down moves in Bullish Falling Channels
3- Volatility in last hour
4- Whole day actual trading between 11541-11617
Conclusions from intra day chart analysis
As selling in first 4 hours therefore slipping in Mid-session but consolidation and support was also seen at lower levels through Down moves in Bullish Falling Channels.
Although volatility in last hour but both higher levels selling and lower levels some buying also therefore firstly sustaining beyond day's trading range(11541-11617) should be watched tomorrow for first signal of next decisive moves beginning after August derivative expiry.