Technical Analysis,Research & Weekly Outlook
(Dec 24 to Dec 28,2012)
Nifty-EOD Chart (21-Dec-2012):- |
| Just click on chart for its enlarged view |
1- 4770.35 on 04-06-2012(Correctine Wave-2 completion and impulsive Wave-3 beginning)
2- 5348.55 on 10-07-2012(Sub Wave-1)
3- 5032.40 on 26-07-2012(Sub Wave-2)
4- 5815.35 on 05-10-2012(Sub Wave-3)
5- 5548.35 on 20-11-2012(Sub Wave-4)
6- 44 Sessions sideways Sub Wave-4 correction between 5549-5815 with Bullish Flag formation.
7- 44 Sessions break out above 5815 on 29-11-2012.
8- Sub Wave-5 of Wave-3 confirmation and continuation.
9- 15 Sessions sideways trading between 5823-5965.
Conclusions from EOD chart analysis
Sub Wave-5 of Wave-3 continuation after completion of 44 sessions Sub Wave-4 sideways correction between 5549-5815. Although 44 sessions trading range broken out forcefully on 29-11-2012 but no strong rally after break out and market again trapped sideways between 5823-5965 for the last 15 sessions. As last 15 sessions trading range is just above the top of previous 44 sessions trading range therefore firstly technical positions of last 15 sessions trading has to be understood.
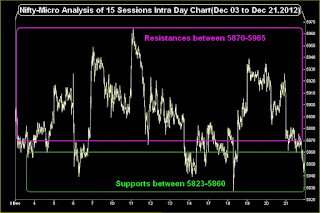
Nifty-Micro Analysis of 15 Sessions Intra Day Chart
(Dec 03 to Dec 21,2012)
Nifty-Intra Day Chart (Dec 03 to Dec 21,2012):- |
| Just click on chart for its enlarged view |
1- Supports between 5823-5860
2- Resistances between 5870-5965
3- 15 Sessions sideways trading between 5823-5965
Conclusions from 15 Sessions intra day chart analysis
Good selling and strong resistances formations at higher levels and lower levels some supports which have weakened also in previous week.
Conclusions (After Putting All Studies Together)
All trends are up and Sub Wave-5 of Wave-3 continuation after Sub Wave-4 correction completion with Bullish Flag formation. As Sub Wave-5 did not showed strong rally and turned side ways for the last 15 sessions as well as good selling also at higher levels therefore complete consolidation is required in the coming week for break out of last 15 sessions trading range. View is cautious now because follow up selling with slipping below 5815 will mean also possibility of false break out on 29-11-2012.
As intraday supports also seen at lower levels in last 15 sessions sideways trading therefore impulsive Sub Wave-5 of Wave-3 rally hopes are still alive but follow up complete consolidation is must in the beginning of next week for decisive up moves above 5965. As last 15 sessions sideways trading range(5823-5965) is most crucial and next trend deciding therefore its valid break out should be firstly watched in the coming week/weeks for next following moves confirmations:-
1- Above 5965 will mean strong rally of Sub Wave-5 of Wave-3.
2- Below 5823 will mean Sub Wave-5 failure and reentering into 44 sessions sideways trading range with shifting of next supports above 5549.

