

Nifty-Intra Day Chart (26-Nov-2012):-
Technical Patterns and Formations in today intraday charts
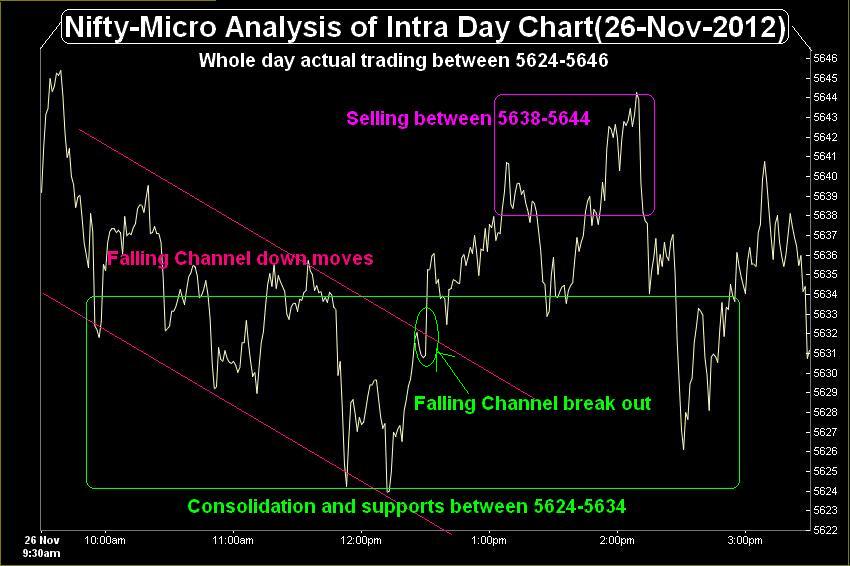
1- Falling Channel down moves.
2- Falling Channel break out.
3- Consolidation and supports between 5624-5634
4- Selling between 5638-5644
3- Whole day actual trading between 5624-5646
Following lines were told in "Bullish Flag formation confirming strong Wave-5 Rally" on 24-11-2012
"As selling between 5620-5650 also therefore follow up consolidation is also required for sustaining above 5650"
Nifty traded whole day today within above mentioned range between 5623.45-5649.20 but with mixed intraday patterns. Although only follow up consolidation was required and it was seen also at lower levels between 5624-5634 but higher levels selling also seen between 5624-5646.
Nifty actual trading within 22 points between 5624-5646 with both buying and selling patterns therefore more technical positions are required for one sided decisive moves. Coming sessions markets may be affected by political news also because 3 consecutive days Parliament adjournments on FDI and if this situation does not resolve early then sentiment may be nervous and fresh selling can not be ruled out.
 |
| Just click on chart for its enlarged view |
1- Falling Channel down moves.
2- Falling Channel break out.
3- Consolidation and supports between 5624-5634
4- Selling between 5638-5644
3- Whole day actual trading between 5624-5646
Conclusions from intra day chart analysis
Following lines were told in "Bullish Flag formation confirming strong Wave-5 Rally" on 24-11-2012
"As selling between 5620-5650 also therefore follow up consolidation is also required for sustaining above 5650"
Nifty traded whole day today within above mentioned range between 5623.45-5649.20 but with mixed intraday patterns. Although only follow up consolidation was required and it was seen also at lower levels between 5624-5634 but higher levels selling also seen between 5624-5646.
Nifty actual trading within 22 points between 5624-5646 with both buying and selling patterns therefore more technical positions are required for one sided decisive moves. Coming sessions markets may be affected by political news also because 3 consecutive days Parliament adjournments on FDI and if this situation does not resolve early then sentiment may be nervous and fresh selling can not be ruled out.
Follow up buying/selling and sustaining beyond immediate resistance range(5620-5650) will decide next Short Term moves and should be firstly watched in the coming sessions.