It is clear from both previous topics that Indian markets are technically not prepared for any side decisive break out and weekly closing in the center of previous week range after both selling at higher levels and buying at lower levels. Indian markets will prepare in the coming 1/2 sessions for next moves and follow up buying/selling will trigger break out/down.
Rally begun on 20-12-2011 from 4531.15 and correction started from 5629.95 after 1098.80 Nifty Points rally in 45 sessions. Immediate technical positions of this rally are as follows:-
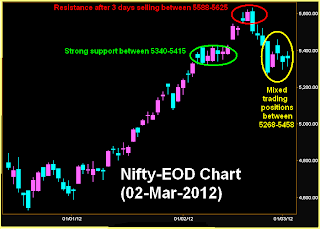
Nifty-EOD Chart(02-Mar-2012):-
1- Resistance after 3 days selling between 5588-5625
2- Strong support between 5340-5415
3- Mixed trading positions between 5268-5458 in previous week.
Only one resistance range above previous week trading range and sustaining above 5458 will be confirmation of correction completion as well as testing of above mentioned resistance range with high possibility of sustaining as well as blasting rally also above 5625 because fresh impulsive wave will develop above 5458 after correction completion.
Rally begun on 20-12-2011 from 4531.15 and correction started from 5629.95 after 1098.80 Nifty Points rally in 45 sessions. Immediate technical positions of this rally are as follows:-
Nifty-EOD Chart(02-Mar-2012):-
 |
| Just click on chart for its enlarged view |
Conclusions from EOD chart analysis
1- Resistance after 3 days selling between 5588-5625
2- Strong support between 5340-5415
3- Mixed trading positions between 5268-5458 in previous week.
Only one resistance range above previous week trading range and sustaining above 5458 will be confirmation of correction completion as well as testing of above mentioned resistance range with high possibility of sustaining as well as blasting rally also above 5625 because fresh impulsive wave will develop above 5458 after correction completion.

