Watch next supports,resistances &
55-Day SMA for next next Trend
formations & bigger moves beginning confirmations amid Middle-East war
led Geo-Global uncertainty
Technical Analysis,Research & Weekly
Outlook(Oct 07 to Oct 11,2024)
Nifty-EOD Chart Analysis
(Waves structure)
Nifty-EOD Chart (04-Oct-2024):-

Technical Patterns and Formations in EOD charts
1- Corrective Wave-C of previous Waves structure "ABC correction" completion at 15183.40 on 17-06-2022 and Impulsive Wave-1 of new Waves structure beginning.
2- Impulsive Wave-1 completion at 18887.60 on 01-12-2022.
3- Corrective Wave-2 completion at 16828.30 on 20-03-2023.
4- Impulsive Wave-(i) of Wave-3 completion at 20222.45 on 15-09-2023 and Wave-A of "ABC" correction beginning.
5- Wave-A of Wave-(ii) of Wave-3 completion at 19333.60 on 04-10-2023.
6- Wave-B of Wave-(ii) of Wave-3 completion at 19849.80 on 17-10-2023.
7- Corrective Wave-C of Wave-(ii) of Wave-3 completion at 18837.80 on 26-10-2023 and impulsive Wave-(iii) of Wave-3 beginning.
8- Impulsive Wave-(iii) of Wave-3 continuation with its recent high and new life time top formations at 26277.30 on 27-09-2024.
9- Short Term correction continuation with recent bottom formations at 24966.80 on 04-10-2024.
Conclusions from EOD chart analysis
(Waves structure)
Impulsive Wave-1 of new Waves structure started from 15183.40 on 17-06-2022 after Corrective Wave-C of "ABC correction" of previous Waves structure completion at this level. Wave-1 completed at 18887.60 on 01-12-2022 and from this level Wave-2 begun which completed at 16828.30 on 20-03-2023 and Impulsive Wave-3 begun from this level which is now in continuation.
Impulsive Wave-(i) of Wave-3 completed at 20222.4 on 15-09-20235 and from this level corrective Wave-A of "ABC" correction of Wave-(ii) of Wave-3 started which completed at 19333.60 on 04-10-2023 and Wave-B begun from this level. Wave-B completed at 19849.80 on 17-10-2023 and Wave-C started from this levels which completed at 18837.80 on 26-10-2023 and impulsive Wave-(iii) of Wave-3 begun from this level.
Now impulsive Wave-(iii) of Wave-3 is in continuation with its recent high and new life time top formations at 26277.30 on 27-09-2024. Although no confirmation of Wave-(iii) of Wave-3 completion yet on EOD charts but Short Term correction begun in previous week which is now in continuation with its recent bottom formations at 24966.80 on 04-10-2024 and no signal of its completion yet on EOD charts.
Nifty-EOD Chart Analysis
(Stochastic & MACD)
Nifty-EOD Chart (04-Oct-2024):-

Technical Patterns and Formations in EOD charts
1- Stochastic- %K(5) line has intersected %D(3) line downward and its both lines are falling in Over sold zone.
2- Stochastic:- %K(5)- 05.42 & %D(3)- 13.74.
3- In MACD- Its both MACD line and Average line are kissing in positive zone.
4- MACD(26,12)- 339.00 & EXP(9)- 367.27 & Divergence- -28.27
Conclusions from EOD chart analysis
(Stochastic & MACD)
Technical positions of Short Term indicators are as follows:-
1- As in Stochastic its %K(5) line has intersected %D(3) line downward and its both lines are falling in Over sold zone therefore it will be understood that at present this indicator is showing first signal of on going on Short Term correction completion but not confirmations therefore let its both lines to move above Over sold zone after upward intersection then Short Term Upward moves will be seen.
2- As in MACD indicator its both MACD and Average lines are kissing in positive zone therefore it will be understood that at present this indicator is not confirming on going Upward Trend completion and cautioning only. Let any side clear intersection happen then that side bigger decisive moves will begin after that side Short Term Trend formation confirmations
Nifty-EOD Chart Analysis
(Averages)
Nifty-EOD Chart (04-Oct-2024):-

Technical Patterns and Formations in EOD charts
Averages:-
1- 5-Day SMA is today at 25611
2- 21-Day SMA is today at 25485
3- 55-Day SMA is today at 24990
4- 100-Day SMA is today at 24270
5- 200-Day SMA is today at 23136
Conclusions from EOD chart analysis
(Averages)
As Nifty is now well above Long Term Trend decider 200-Day SMA therefore Long Term Trend is confirm up but Short Term Trend is confirm down because Nifty closed well below its decider 21-Day SMA last Friday. Although Intermediate Term trend is still up but at stake because Nifty closed little above its decider 55-Day SMA after slipping below it last Friday and firstly sustaining beyond 55-Day SMA(today at 24990) should be watched in the coming week/weeks for that side next Intermediate Term trend formations and resultant that side one sided bigger moves beginning confirmations.
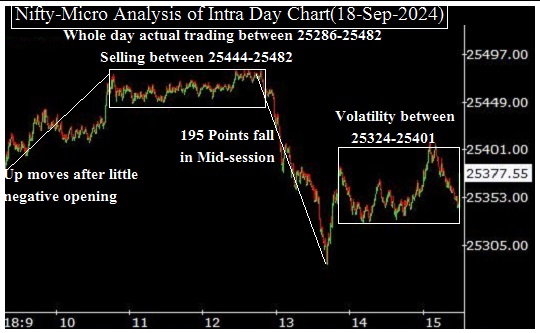
Nifty-Intra Day Chart Analysis
(04-Oct-2024)
Nifty-Intra Day Chart (04-Oct-2024):-

Technical Patterns formation in today intraday charts
1- Up moves with downward corrections
2- High volatility in Mid-Session
3- Down moves in Bullish Falling Channels in the last more than 2 hours
4- Whole day actual trading between 24967-25485
Conclusions from intra day chart analysis
Although Nifty traded 150 points down in first 16 minutes after gap down opening but after that upward moves started with downward corrections which is a consolidation pattern therefore finally sharp up moves were seen and Nifty traded 235 points also. As higher levels good intraday selling was seen in previous sessions therefore Nifty could not sustain at higher levels and fallen sharply also as well as lost 394 points in only 31 minutes and in this manner high volatility was seen in Mid-Session.
As last more than 2 hours down moves were in Bullish Falling Channels which is also a consolidation pattern and consolidation pattern was seen in first 2 hours also therefore lower levels good intraday consolidation will be understood last Friday and firstly upward moves are expected towards last Friday highest in the beginning of next week.
Conclusions
(After putting all studies together)
1- Long Term Trend is up.
2- Intermediate Term trend is at stake.
3- Short Term Trend is down.
Although now impulsive Wave-(iii) of Wave-3 is in continuation and no confirmation of its completion yet on EOD charts but Short Term correction forcefully begun in which Nifty corrected 1041 points in last 4 sessions of previous week. Now correction is in continuation no confirmation of its completion also on EOD and intraday charts.
Remain cautious in the coming week/weeks because Geo Political tension is high after Iran attack on Israel in previous week therefore Indian markets and other Global markets and if war escalate in Middle-East then deeper correction will be seen.
Now Short Term indicator MACD is not confirming any side decisive moves beginning possibility but another indicator Stochastic is completely Oversold and suggesting that Very Short Term upward moves may begun after its %K(5) line upward intersection of %D(3) line and its both lines to move above Oversold zone.
As Nifty hovered around Intermediate Term trend decider 55-Day SMA(today at 24990) in last hour of previous trading day therefore firstly sustaining it beyond should be watched in the coming week because its also turning down will mean minimum 3 weeks to 3 months long correction.
Intraday charts of last Friday are showing lower levels consolidation patterns therefore upward moves are expected towards following next resistances:-
1- 25421-25468
2- 25592-25626
3- 25640-25739
4- 25787-25828(Gap Resistance)
5- 25886-25912
6- 25969-25606
7- 26135-26151(Gap Resistance)
Next supports below last Friday lowest are as follows:-
1- 24894-24927
2- 24816-24872
3- 24655-24709
4- 24533-24574
5- 24475-24497
6- 24394-24446
7- 24205-24272
8- 24117-24179
9- 23977-24094
10- 23932-24027
Although firstly upward moves signals in the beginning of next week but finally watch sustaining beyond above mentioned next supports,resistances and Intermediate Term trend decider 55-Day SMA(today at 24990) one by one amid Middle-East war led Geo-Global uncertainty for next Trend formations and bigger moves beginning confirmations.