ॐ ह्रीं श्रीं लक्ष्मीभयो नमः॥


 This is the "Oldest & Only Website" of whole World
which is updating Nifty & Indian Stock Markets
"Daily and Weekly accurate Outlooks" 
with "Intraday Charts Analysis"for the 
last more than "14 years" means from "2010"
For its live Proofs just see "Archive"
in the "bottom of this Website".

Trading "calls" from our "Software" with more than "90% accuracy"

 Remain cautious amid deeper 
correction beginning possibility
Technical Analysis,Research & 
Weekly Outlook(Apr 18 to Apr 22,2020)
Nifty-EOD Chart Analysis
(Stochastic & MACD)
Nifty-EOD Chart (13-Apr-2020):-
Technical Patterns and Formations in EOD charts

1- Impulsive Wave-5 completion after new life time top formation at 18604.50 on 19-10-2021 and corrective Wave-A of "ABC" correction beginning.
2- Corrective Wave-A completion at 16410.20 on 20-12-2021
3- Wave-B completion at 18351.00 on 18-01-2022.
4- Wave-C bottom formation at 15671.5 on 08-03-2022
5- Pull Back Rally continuation with recent top formation at 18114.70 on 04-04-2022
6- Last 11 Sessions trading between 17388-18114 
7- Stochastic- %K(5) line has intersected %D(3) line downward and its both lines are falling in Over bought zone.
8- Stochastic:- %K(5)- 14.18 & %D(3)- 21.62.
9- In MACD- MACD line has intersected Average line downward and its both lines are falling in positive zone.
10- MACD(26,12)- 391.78 & EXP(9)- 486.98 & Divergence- -95.2

Conclusions from EOD chart analysis
(Stochastic & MACD)

Pull Back Rally continuation with recent top formation at 18114.70 on 04-04-2022 and no confirmation of its completion yet on EOD charts but last 11 Sessions trading between 17388-18114 and finally sustaining beyond this range will confirm its fate.

Although both lines of Stochastic are falling in Over bought zone but %K(5) line has not intersected %D(3) line upward and negative divergence has also not been seen yet therefore no confirmation of up moves beginning yet.

As in MACD MACD line has intersected Average line downward and its both lines are falling in positive zone therefore showing signals of downward trend formation. 

Nifty-EOD Chart Analysis
(Averages)
Nifty-EOD Chart (13-Apr-2020):-
Technical Patterns and Formations in EOD charts

1-Averages
A- 5-Day SMA is today at   17621 
B- 21-Day SMA is today at  17433
C- 55-Day SMA is today at  17169
D- 100-Day SMA is today at 17297
E- 200-Day SMA is today at 17158 

Conclusions from EOD
chart analysis (Averages)

Although Nifty moved below 5-Day SMA but got supports just above 21-Day SMA in last 2 sessions therefore firstly sustaining 17433 should be firstly watched in next week for first signal of next trend formations. As all the Intermediate and Long Term averages have turned flat therefore finally sustaining beyond all these Averages and specially 200-Day SMA(17158) should be watched in next week for Long Term Trend confirmations which is at stake after its being flat . 

Nifty-Last 11 Sessions
intraday charts analysis
Nifty-Intra Day Chart (Mar 30 to Apr 13,2020):-
Technical Patterns formation in last 11 Sessions intraday charts

1- Selling(Resistances) in last 11 Sessions are as follows:-
A- 17478-17537 
B- 17524-17561 
C- 17616-17663 
D- 17727-17779
E- 17802-17842
F- 17818-17901 
G- 17975-18095 
2- Consolidation(Supports) in last 11 Sessions are as follows:-
A- 17457-17518
B- 17388-17533 
3- Last 11 Sessions actual trading between 17388-18114 

Conclusions from 11 Sessions
intra day chart analysis 

As intraday consolidation after 30-03-2022 therefore strong up moves were seen in the beginning of Apr-2022 but higher levels selling developed therefore not sustaining at higher levels and continuous down moves were seen in last 7 sessions with follow up selling and resultant above mentioned higher levels multiple resistances developed.

Now last 2 supports of last 11 sessions are between 17388-17533 and fresh selling was seen  within this range between 17478-17537 on 13-04-2022 therefore these supports have been weakened and higher levels good selling also in last 7 sessions therefore expected that firstly down moves will be seen in the beginning of next week and once sustaining below last 11 sessions lowest(17388) will mean deeper correction beginning after last 11 sessions trading range broken down confirmations.

Nifty-Intra Day Chart Analysis
(13-Apr-2020)
Nifty-Intra Day Chart (13-Apr-2020):-
Technical Patterns formation in today intraday charts

1- Selling between 17616-17663
2- Selling between 17524-17561
3- Selling between 17478-17537
4- Whole day actual trading between 17458-17663

Conclusions from intraday
chart analysis 

Although strong opening but not sustaining at higher levels because immediately selling developed which remained continued till last hours. As good intraday selling on 13-04-2027 therefore down moves will be seen below day's lowest(17458) in the beginning of next week.

Conclusions
(After putting all studies together)

1- Long Term Trend is up.
2- Intermediate Term Trend is up.
3- Short Term Trend is down

Pull Back Rally which started from 15671.5 on 08-03-2022 is in continuation with recent top formation at 18114.70 on 04-04-2022 and no confirmation of its completion yet on EOD charts after gaining 2443 Points. As long Weekly Black Candle formation in previous week and Weekly Doji candle was formed before previous week as well as previous sessions closing was at the lowest of last 7 sessions therefore strong indication of more down moves in next week because higher levels good intraday selling was seen in last 7 sessions.

As MACD is showing signals of downward trend formation and Stochastic has not produced any upward move signal therefore more down moves can not be ruled out in next week and firstly sustaining below last 11 sessions lowest(17388) should be watched for first strong signal of deeper correction beginning and finally sustaining beyond 200-Day SMA(17158) should also be watched for Long Term Trend formation and next big moves beginning confirmations. Next supports below 11 sessions lowest(17388) are as follows:-

1- 17344-17387(Gap Support)
2- 17236-17387
3- 17138-17185
4- 17004-17081

As Long Term Trend  will also be down below 17158 therefore remain cautious because down moves are expected in the beginning of next week. Firstly 17388 and after that above mentioned supports should be watched and once sustaining below 17004 will mean deeper correction beginning of on going Pull Back Rally which is possible also after good higher levels intraday selling in previous weeks. 
Watch levels for next decisive 
moves beginning confirmations
Nifty-Intra Day Chart Analysis & 
Market Outlook(12-04-2022)
Nifty-Intra Day Chart (11-Apr-2020):-
Technical Patterns formation in today intraday charts

1- Sharp fall after gap down opeing
2- Down moves in Bullish Falling Channels
3- Sharp up in Mid-session
4- Up moves in Bearish Rising Channel
5- Sharp fall in last hour
6- Whole day actual trading between 17443-17595

Conclusions from intra day chart analysis 

Although firstly sharp fall after gap down opening but Down moves were also in Bullish Falling Channels therefore sharp up moves were seen in Mid-session. As selling developed at intraday higher levels through Up moves in Bearish Rising Channel also therefore Sharp fall was also seen in last hour.

As whole day intraday volatility with both lower levels some buying and higher levels selling also therefore sustaining beyond today trading range(17443-17595) should be watched tomorrow for next decisive moves beginning confirmations.

Correction of 2443 Points Pull Back Rally will begin

 Correction of 2443 Points 
Pull Back Rally will begin
Nifty-Intra Day Chart Analysis & 
Market Outlook(12-04-2022)
Nifty-Intra Day Chart (11-Apr-2020):-
Technical Patterns formation in today intraday charts

1- Up moves in Bearish Rising Channels
2- Selling between 17727-17779(immediate Resistances)
3- Sharp falls in last hour
4- Whole day actual trading between 17650-17779

Conclusions from intra day chart analysis 


firstly Nifty will trade and prepare for next decisive moves within last Friday trading range(17601-17842) in the beginning of next week

As was told 100% same happened and:- 

Nifty traded whole day within mentioned range(17601-17842) between 17650-17779 on 11-04-2022.

We clearly told and concluded in above mentioned Outlook that:-

 "higher levels selling in previous week therefore remain cautious in next week because sustaining below 17601 will confirm 2443 Points Pull Back Rally correction."

As good intraday selling on 11-04-2022 therefore Nifty will trade below 17601 and correction of 2443 Points Pull Back Rally will begin as well as its continuation will also be seen in the coming sessions. 
 Remain cautious from 2443 Points rally correction possibility amid firstly sideways market between 17601-18114 
Technical Analysis,Research & Weekly Outlook(Apr 11 to Apr 13,2020)
Nifty-EOD Chart Analysis
(Stochastic & MACD)
Nifty-EOD Chart (08-Apr-2020):-
Technical Patterns and Formations in EOD charts

1- Impulsive Wave-5 completion after new life time top formation at 18604.50 on 19-10-2021 and corrective Wave-A of "ABC" correction beginning.
2- Corrective Wave-A completion at 16410.20 on 20-12-2021
3- Wave-B completion at 18351.00 on 18-01-2022.
4- Wave-C bottom formation at 15671.5 on 08-03-2022
5- Pull Back Rally continuation with recent top formation at 18114.70 on 04-04-2022
6- Last 5 Sessions actual trading between 17601-18114 
7- Stochastic- %K(5) line has intersected %D(3) line downward and its both lines are falling towards Over sold zone.
8- Stochastic:- %K(5)- 55.12 & %D(3)- 73.23.
9- In MACD- MACD line has intersected Average line upward and its both lines are rising in positive zone.
10- MACD(26,12)- 535.59 & EXP(9)- 465.80 & Divergence- 69.79

Conclusions from EOD chart analysis
(Stochastic & MACD)

Pull Back Rally started after Wave-C bottom formation at 15671.5 on 08-03-2022 and its is in continuation with recent top formation at 18114.70 on 04-04-2022 as well as no confirmation of its completion yet after gaining 2443.2 points. As last 5 Sessions trading between 17601-18114 therefore finally its valid break out will confirm next trend which should be firstly watched in the coming week.

As both lines of Short term indicator Stochastic are falling towards Over sold zone therefore suggesting some more down moves possibilities in next week. Although both lines of MACD are rising in positive zone but MACD line has started to flatten therefore remain watchful also in the coming weeks despite no other downward trend formation signal yet.

Nifty-Last 5 Sessions 
intraday charts analysis
Nifty-Intra Day Chart (Apr 04 to Apr 08,2020):-
Technical Patterns formation in last 5 Sessions intraday charts

1- Selling(Resistances) in last 5 sessions are as follows:-
A- 17802-17842
B- 17818-17901 
C- 17975-18095 
2- Consolidation(Supports) in last 5 sessions are as follows:-
A- 17703-17744
B- 17601-17675 
3- Last 5 Sessions actual trading between 17601-18114 

Conclusions from 5 Sessions
intra day chart analysis 

Last 5 Sessions trading between 17601-18114 with above mentioned supports and resistances within it. Although firstly slipping after higher levels good selling but lower levels some supports were also seen therefore Nifty will firstly traded and prepare for next trend within this range in the coming week therefore sustaining it beyond should also be watched for next trend beginning confirmations. 

Nifty-Intra Day Chart Analysis &
Market Outlook(11-04-2022)
Nifty-Intra Day Chart (08-Apr-2020):-
Technical Patterns formation in today intraday charts

1- Firstly 97 Points fall after positive opening
2- Consolidation between 17601-17675
3- Up moves with downward corrections & consolidation 
4- Consolidation between 17703-17744
5- Selling between 17802-17842
6- Whole day actual trading between 17601-17842

Conclusions from intra day chart analysis 

Although firstly 97 Points fall after positive opening but lower levels consolidation developed between 17601-17675 therefore up moves begun which remained continued with follow up Mid-session consolidation between 17703-17744. As higher levels selling was also seen between 17802-17842 therefore down moves developed in last hour. 

Until complete fresh selling will not develop till then Nifty will not slip and sustain below last Friday lowest(17601) because lower levels good consolidation was seen and fresh consolidation in the beginning of next week will mean on going rally continuation towards and above 18000.

As both lower levels good intraday consolidation and higher levels some selling also last Friday therefore firstly Nifty will trade and prepare for next decisive moves within last Friday trading range(17601-17842) in the beginning of next week and finally this range break out will confirm next decisive moves which should be firstly watched for its beginning confirmations. 

Conclusions
(After putting all studies together)

1- Long Term Trend is up.
2- Intermediate Term Trend is up.
3- Short Term Trend has turned sideways for the last 5 sessions.

2443 Points gaining Pull Back Rally which started from 15671.5 on 08-03-2022 is in continuation with recent top formation at 18114.70 on 04-04-2022 and no confirmation of its completion yet on EOD charts but Weekly Doji candle formation in previous week which is suggesting indecision and confusion on the side of both buyers and sellers.. 

As sideways trading was seen between 17601-18114 in last 5 sessions with higher levels good selling also therefore if fresh selling develops in next week then correction of this 2443 Points rally will begin in the coming week but complete fresh selling is firstly required for sustaining below 17601 because lower levels good consolidation was also seen last Friday. 

Although finally 17601-18114 break out will confirm next trend but short term indicator Stochastic is showing some more down moves possibilities and MACD is also suggesting watchful approach as well as higher levels selling in previous week therefore remain cautious in next week because sustaining below 17601 will confirm 2443 Points Pull Back Rally correction.
Firstly watch next supports for the life of last 3 sessions correction
Nifty-Intra Day Chart Analysis & 
Market Outlook(08-04-2022)
Nifty-Intra Day Chart (07-Apr-2020):-
Technical Patterns formation in today intraday charts

1- Whole day intraday volatility Only
2- Whole day actual trading between 17624-17787

Conclusions from intra day chart analysis 

Down moves towards next supports was told for today and Nifty closed 0.94% down at 17639.55 which was just above yesterday mentioned 1st supports(17568-17597).

As whole day only inraday volatility and one sided any clear cut intraday trading pattern formation was not seen therefore firstly sustaining beyond next 1st supports(17568-17597) should be watched tomorrow for the life of last 3 sessions correction.
 Down moves towards next supports
Nifty-Intra Day Chart Analysis &
Market Outlook(07-04-2022)
Nifty-Intra Day Chart (06-Apr-2020):-
Technical Patterns formation in today intraday charts

1- Selling between 17818-17901
2- Whole day actual trading between 17780-17901

Conclusions from intra day chart analysis 

As firstly huge gap down opening and after that whole day good selling between  17780-17901 therefore down moves are expected below today lowest(17780) and towards following next supports:-

1- 17568-17597
2- 17512-17553
3- 17436-17485

 Down moves after good intraday selling
Nifty-Intra Day Chart Analysis &
 Market Outlook(06-04-2022)
Nifty-Intra Day Chart (05-Apr-2020):-
Technical Patterns formation in today intraday charts

1- Sharp down after positive opening
2- Selling between 17975-18095
3- Sharp fall in last hour
4- Whole day actual trading between 17922-18095

Conclusions from intra day chart analysis 

Following lines were told on 04-04-2022 in "Firstly rally continuation amid big intraday correction possibility":-

1- on going rally will remain continued.
2- big intraday correction may also be seen

As was told 100% same happened:-

1- Firstly up moves were seen after positive opening
2- Nifty traded 131 points down.

Although firstly positive opening but immediately sharp fall was seen and after that good intraday selling developed between 17975-18095 therefore sharp fall in last hour on 05-04-2022 and resultant down moves will remain continued in the coming session also.
 Firstly rally continuation amid big intraday correction possibility
Nifty-Intra Day Chart Analysis & 
Market Outlook(05-04-2022)
Nifty-Intra Day Chart (04-Apr-2020):-
Technical Patterns formation in today intraday charts

1- Sharp up after gap up opening
2- Down moves in Bullish Falling Channel upto 17895
3- Up moves with downward corrections
4- Whole day actual trading between 17792-18114

Conclusions from intra day chart analysis 

Following conclusive lines were told on 02-04-2022 in " Firstly rally continuation and finally 17436-18351 will confirm next big moves":-

1- Pull Back Rally continuation towards next psychological level at 18000.
2- Firstly rally continuation expectations in next week

As was told 100% same happened and Rally remained continued above 18000 as well as closed above it today.

Firstly sharp up moves after gap up opening and after that higher levels good consolidation also through Down moves in Bullish Falling Channel up to 17895 as well as up moves with downward corrections therefore whole day good consolidation will be understood and on going rally will remain continued.

As sentiment has turned extremely heated and Very Short Term indicators have also moved into Overbought zone therefore big intraday correction may also be seen but until Nifty will not sustain below 17895 till then decisive moves will not be seen because good consolidation was seen above it today.
 Firstly rally continuation and finally 17436-18351 will confirm next big moves
Technical Analysis,Research & Weekly Outlook
(Apr 04 to Apr 08,2020)
Nifty-EOD Chart Analysis
(Waves structure)
Nifty-EOD Chart (01-Apr-2020):-
Technical Patterns and Formations in EOD charts

1- Impulsive Wave-1 beginning from 7511.10 on 24-03-2020  
2- Impulsive Wave-1 completion at 11794.30 on 31-08-2020  
3- Corrective Wave-2 completion at 10790.20 on 24-09-2020
4- Impulsive Wave-3 completion at 15431.8 on 16-02-2021
5- Corrective Wave-4 completion at 14151.4 on 22-04-2021
6- Impulsive Wave-5 completion after new life time top formation at 18604.50 on 19-10-2021 and corrective Wave-A of "ABC" correction beginning.
7- Corrective Wave-A completion at 16410.20 on 20-12-2021
8- Wave-B completion at 18351.00 on 18-01-2022.
9- Wave-C bottom formation at 15671.5 on 08-03-2022
10- Pull Back Rally continuation with recent top formation at 17703.70 on 01-04-2022  

Conclusions from EOD chart analysis
(Waves structure)

Waves structure which begun through its Impulsive Wave-1 from 7511.10 on 24-03-2020 completed after its 5th Wave termination at 18604.50 on 19-10-2021 and corrective Wave-A of "ABC" correction started. Wave-C bottom of "ABC" correction formed at 15671.5 on 08-03-2022 and after that Pull Back Rally begun which is in continuation with recent top formation at 17703.70 on 01-04-2022. 
Nifty-EOD Chart Analysis
(Stochastic & MACD)
Nifty-EOD Chart (01-Apr-2020):-
Technical Patterns and Formations in EOD charts

1- Impulsive Wave-5 completion after new life time top formation at 18604.50 on 19-10-2021 and corrective Wave-A of "ABC" correction beginning.
2- Corrective Wave-A completion at 16410.20 on 20-12-2021
3- Wave-B completion at 18351.00 on 18-01-2022.
4- Wave-C bottom formation at 15671.5 on 08-03-2022
5- Pull Back Rally continuation with recent top formation at 17703.70 on 01-04-2022
6- Stochastic- %K(5) line has intersected %D(3) line upward and its both lines are rising within Over bought zone.
7- Stochastic:- %K(5)- 91.16 & %D(3)- 82.59.
8- In MACD- MACD line has intersected Average line /upward and its both lines are rising in positive zone.
9- MACD(26,12)- 459.70 & EXP(9)- 322.03 & Divergence- 137.67

Conclusions from EOD chart analysis
(Stochastic & MACD)

Although Pull Back Rally continuation after Wave-C bottom formation at 15671.5 on 08-03-2022 and no confirmation of its completion yet on intraday and EOD charts but both lines of Short term indicator Stochastic have moved into bought zone and showing first signal of Short Term correction beginning. As both lines of MACD are rising in positive zone therefore confirming that upward trend is completely intact.

Nifty-EOD Chart Analysis
(Averages)
Nifty-EOD Chart (01-Apr-2020):-
Technical Patterns and Formations in EOD charts

1-Averages
A- 5-Day SMA is today at   17436
B- 21-Day SMA is today at  16915
C- 55-Day SMA is today at  17214
D- 100-Day SMA is today at 17315
E- 200-Day SMA is today at 17078 

Conclusions from EOD chart analysis
(Averages)

As Nifty has closed above all the Short to Long Term Averages and some Averages have started to rise also therefore suggesting that Indian markets are in Bullish mode and on going Pull Back rally will remain continued.

Nifty-Intra Day Chart Analysis
(01-Apr-2020)
Nifty-Intra Day Chart (01-Apr-2020):-
Technical Patterns formation in today intraday charts

1- Up moves after weaker opening
2- Consolidation between 17512-17553
3- Consolidation between 17568-17597
4- Sharp  125 Points jump was seen in last half hour
5- Whole day actual trading between 17423-17703

Conclusions from intra day chart analysis 

Although weaker opening but after that recovery from lower levels and 2 times sideways good consolidation also therefore sharp 125 Points jump was seen in last half hour and closing was at the top of the day.

As good consolidation between 17512-17597 therefore rally will remain continued and until complete selling will not develop till then Nifty will not sustain below 17512.As sentiment has turned heated after last Friday strong rally therefore some intraday correction can not be ruled between and near about 17597-17703 before fresh decisive rally above 17703.

Conclusions
(After putting all studies together)

All the trends are up and Pull Back Rally continuation towards next psychological level at 18000. As Nifty has closed above Long Term Trend decider 200-Day SMA(today at 17078) in last 11 sessions therefore confirming that Long Term Trend has turned up and on going rally will remain continued as well as until complete selling patterns will not develop on intraday and EOD charts till then any big correction will not be seen because Nifty has closed above last 35 sessions trading range also. 

As both lines of Short term indicator Stochastic have moved into bought zone and showing first signal of Short Term correction beginning as well as sentiment has turned heated therefore Short Term correction may begin also any day but intraday charts have not shown selling patterns formations yet therefore let complete selling patterns develop on intraday charts then Short Term correction will begin hence remain watchful also.

Next resistances above last Friday highest(17703.70) are as follows:-

1- 17795-17832
2- 17959-18129
3- 18292-18321
4- 18379-18458
5- 18548-18604 

Next supports above last Friday closing(17670.50) are as follows:-

1- 17568-17597
2- 17512-17553
3- 17436-17485
4- 17344-17387(Gap Support)
5- 17236-17387
6- 17138-17185
7- 17004-17081

Wave-C bottom was formed at 15671.5 and Nifty has moved up 2031 points from this levels as well as Long Term Trend has turned up therefore strong signals of Wave-C completion at 15671.5 and news Waves structure formation from this level for fresh rally above life time highest(18604.50),its confirmation will be after moving the top of Wave-B at 18351.00.

Firstly rally continuation expectations in next week and until Nifty will not sustain below 17436 till then deeper correction will not be seen as well as moving above 18351 will confirm rally above life time highest therefore Nifty will trade and prepare for next big moves between 17436-18351 in the coming week/weeks as well as finally confirm next big moves after moving beyond this range.
Watch levels for next decisive moves
 beginning confirmations 
Nifty-Intra Day Chart Analysis & 
Market Outlook(01-04-2022)
Nifty-Intra Day Chart (31-Mar-2022):-
Technical Patterns formation in today intraday charts

1- Down moves in Bullish Falling Channels
2- Whole day actual trading between 17436-17559

Conclusions from intra day chart analysis 

Although nifty moved up 60 points in first half hour but not sustained at higher levels becuse selling between 17485-17515 yesterday and Nifty closed below 17485 today. As some consolidation was also seen today through Down moves in Bullish Falling Channels therefore it will understood that Nifty is preparing for next decisive moves between 17436-17559 and firstly sustaining beyond this range should be watched tomorrow for its beginning confirmations.
Firstly watch sustaining beyond 
17485-17515 today
Post-open Outlook(31-03-2022)

As selling between 17485-17515 yesterday therefore Nifty is hovering around 17515 since today morning but slipped from higher levels also therefore firstly sustaining it beyond should be watched today for next decisive up moves beginning confirmations and correction will confirm after sustaining below 17485 hence sustaining beyond 17485-17515 should be watched for next decisive moves beginning confirmations.
 Down moves expectations
Nifty-Intra Day Chart Analysis & 
Market Outlook(31-03-2022)
Nifty-Intra Day Chart (30-Mar-2022):-
Technical Patterns formation in today intraday charts

1- Slow up moves after gap up strong opening
2- Selling between 17485-17515
3- Whole day actual trading between 17388-17522

Conclusions from intra day chart analysis 

Although gap up strong opening but after that slow up moves seen and higher levels selling also between 17485-17515 therefore down moves are expected below today lowest(17388) tomorrow.
 Firstly watch 17322 for on going
 rally continuation confirmations
Nifty-Intra Day Chart Analysis & 
Market Outlook(30-03-2022)
Nifty-Intra Day Chart (29-Mar-2022):-
Technical Patterns formation in today intraday charts

1- More than 5 hours sideways trading between 17236-17322
2- sharp up moves
3- Whole day actual trading between 17236-17343

Conclusions from intra day chart analysis 

Following last 2 resistances of previous 6 sessions was posted  on 26-03-2022 in "Finally 17007-17442 will confirm next big moves":-

1- 17248-17307
2- 17331-17424
Firstly Nifty traded more than 5 hours sideways between 17236-17322 which was within and about after that above mentioned first resistance range(17248-17307) and after that sharp up moves were seen in last hour. 

Although today closing was at the top of the day but clear consolidation patterns were not seen within 5 hours sideways trading(17236-17322) therefore firstly sustaining above 17322 should be watched tomorrow for on going rally continuation confirmations.
 Up moves above today highest
Nifty-Intra Day Chart Analysis & 
Market Outlook(29-03-2022)
Nifty-Intra Day Chart (28-Mar-2022):-
Technical Patterns formation in today intraday charts

1- Consolidation between 17004-17081
2- Up moves with downward corrections
3- Whole day actual trading between 17004-17235

Conclusions from intra day
chart analysis 

Although firstly slipping 177 points after positive opening but lower levels consolidation between 17004-17081 therefore up moves were seen in last 3 hours which were with downward corrections therefore whole day good consolidation will be understood and resultant up moves above today highest and towards those next resistances will be seen tomorrow which have already been updated in previous Outlook on 26-03-2022.
 Finally 17007-17442 will confirm 
next big moves
Technical Analysis,Research & Weekly 
Outlook(Mar 25 to Apr 01,2022)
Nifty-EOD Chart Analysis
(Stochastic & MACD)
Nifty-EOD Chart (25-Mar-2022):-
Technical Patterns and Formations in EOD charts

1- Impulsive Wave-5 completion after new life time top formation at 18604.50 on 19-10-2021 and corrective Wave-A of "ABC" correction beginning.
2- Corrective Wave-A completion at 16410.20 on 20-12-2021
3- Wave-B completion at 18351.00 on 18-01-2022.
4- Wave-C bottom formation at 15671.5 on 08-03-2022
5- Pull Back Rally continuation with recent top formation at 17442.40 on 23-03-2022 
6- Last 6 Sessions sideways trading between 17007-17442 
7- Stochastic- %K(5) line has intersected %D(3) line downward and its both lines are falling below Over bought zone.
8- Stochastic:- %K(5)- 50.24 & %D(3)- 66.25.
9- In MACD- MACD line has intersected Average line upward and its both lines are rising.
10- MACD(26,12)- 303.47 & EXP(9)- -79.85 & Divergence- 383.32

Conclusions from EOD chart
analysis (Stochastic & MACD)

Pull Back Rally continuation with recent top formation at 17442.40 on 23-03-2022 and no confirmation of its completion yet on EOD and intraday charts but last 6 Sessions sideways trading between 17007-17442 and finally sustaining beyond this range will form and confirm next trend.

As MACD line has intersected Average line upward and its both lines are rising therefore showing Upward trend formations but in Stochastic its both lines are falling below Over bought zone therefore confirming Short Term correction also.

Nifty-EOD Chart Analysis
(Averages)
Nifty-EOD Chart (25-Mar-2022):-
Technical Patterns and Formations in EOD charts

1-Averages
A- 5-Day SMA is today at   17211
B- 21-Day SMA is today at  16734
C- 55-Day SMA is today at  17258
D- 100-Day SMA is today at 17340
E- 200-Day SMA is today at 17037 
 
Conclusions from EOD chart
analysis (Averages)

All the Short to Long term Averages have flattened and Nifty has traded between and near about 
5-Day SMA to 200-Day SMA(except 21-Day SMA) for the last 6 sessions which means that Indian markets are preparing for next big moves which will be firstly decided through sustaining beyond 5-Day SMA(17211) and finally:-

1- Sustaining above 100-Day SMA(17340) will mean all trend turning up confirmations.
2- Sustaining below 200-Day SMA(17037) will mean all trend turning down confirmations.

Nifty-Last 6 Sessions
intraday charts analysis
Nifty-Intra Day Chart (Mar 17 to Mar 25,2022):-
Technical Patterns formation in last 6 Sessions intraday charts

1- Selling(Resistances) in last 6 Sessions are as follows:-
A- 17180-17246
B- 17218-17252
C- 17248-17307
D- 17331-17424
2- Consolidation(Supports) in last 6 Sessions are as follows:-
A- 17077-17145 
B- 170012-17069 
3- Last 6 Sessions actual trading between 17007-17442 

Conclusions from 6 Sessions
intra day chart analysis 

Pull Back Rally which started from 15671.5 on 08-03-2022 has turned sideways between 17007-17442 for the last 6 Sessions with above mentioned supports and resistances within it. As Nifty will firstly traded and prepare for next trend within this range in the coming week therefore sustaining it beyond should also be watched for next trend beginning confirmations. 

Nifty-Intra Day Chart
Analysis(25-Mar-2022)
Nifty-Intra Day Chart (25-Mar-2022):-
Technical Patterns formation in today intraday charts

1- Selling between 17180-17246
2- Consolidation between 17077-17145
3- Whole day trading between 17077-17294

Conclusions from intra day
chart analysis 

Although positive opening last Friday but not sustained at higher levels and slipped into negative zone within first 15 minutes. As firstly selling therefore down moves were seen in Mid-session but lower levels consolidation hence sharp up moves in last half hour.

As both lower levels consolidation and higher levels selling also therefore expected that Nifty will trade within last Friday actual trading range(17077-17246) in the beginning of coming week and prepare for next decisive moves within this range as well as firstly sustaining it beyond should be watched in next week for next decisive moves beginning.

Conclusions
(After putting all studies together)

As on going Pull Back Rally which started from 15671.5 on 08-03-2022 has turned sideways between 17007-17442 for the last 6 sessions and all the Short to Long term Averages except 21-Day SMA have also flattened between 17037-17340 which is within last 6 sessions trading range also therefore finally sustaining beyond 17007-17442 will confirm next Long Term trend.

As above mentioned supports and resistances are lying 17007-17442 therefore firstly sustaining it beyond should be watched in the coming week/weeks because it will confirm following big moves after next Long Term trend formation confirmations.

1- Sustaining above 17442 will mean Long Term Trend turning up confirmations and resultant fresh rally towards and possibly above life time highest(18604.50) after "ABC" correction completion at 15671.5 on 08-03-2022.
2- Sustaining below 17007 will mean Long Term Trend turning down confirmations and resultant fresh down moves towards the bottom of Wave-C at at 15671.5.
 Watch Levels amid down moves expectations
Nifty-Intra Day Chart Analysis & 
Market Outlook(25-03-2022)
Nifty-Intra Day Chart (24-Mar-2022):-
Technical Patterns formation in today intraday charts

1- Up moves in Bearish Rising Channel
2- Down moves in Bullish Falling Channel
3- Selling between 17218-17252
4- Up moves in Bearish Rising Channel
5- Whole day actual trading between 17092-17291

Conclusions from intra day
chart analysis 

Although gap down opening and firstly 150 points negative zone trading but after that 200 points recovery also lower levels. As more than first 2 hours some up moves were in Bearish Rising Channel therefore Down moves were seen in next 1 hours which were in Bullish Falling Channel little above lower levels also hence some recovery from lower levels.

As some selling between 17218-17252 in last hour and selling was seen above it in first 2 hours also but some consolidation was also above 17150 therefore expected that Nifty will firstly trade and prepare for next decisive moves within 17150-17291 and finally sustaining it beyond will confirm next decisive movs which should be watched tomorrow amid down moves expectations towards 17092.
 Down moves towards next supports
Nifty-Intra Day Chart Analysis & 
Market Outlook(24-03-2022)
Nifty-Intra Day Chart Analysis(23-Mar-2022)
Technical Patterns formation in today intraday charts

1- Selling between 17331-17424
2- Sharp fall in Mid-Session
3- Selling between 17248-17307
4- Whole day actual trading between 17200-17442

Conclusions from intra day chart analysis 

Although strong gap up opening but selling developed and not sustaining at higher levels therefore sharp fall was seen in Mid-Session. As again follow up selling in last 3 hours therefore today closing was near the lower levels of the day. 

As only intraday selling patterns formations and consolidation not developed today therefore down moves are expected below today lowest(17200) and towards following next supports between 170012-17069.
 As busy therefore I could not update Stock Market Outlook of today(23-03-2022) but tomorrow Outlook will be posted positively.
 As busy therefore Stock Market Outlook of today(22-03-2022) is not being updated.
 Sideways market within supports & resistances if no big negative news from Russia-Ukraine 
war front
Technical Analysis,Research & Weekly 
Outlook(Mar 21 to Mar 25,2022)
Nifty-EOD Chart Analysis
(Stochastic & MACD)
Nifty-EOD Chart (17-Mar-2022):-
Technical Patterns and Formations in EOD charts

1- Impulsive Wave-5 completion after new life time top formation at 18604.50 on 19-10-2021 and corrective Wave-A of "ABC" correction beginning.
2- Corrective Wave-A completion at 16410.20 on 20-12-2021
3- Wave-B completion at 18351.00 on 18-01-2022.
4- Wave-C bottom formation at 15671.5 on 08-03-2022
5- Pull Back Rally continuation with recent top formation at 17344.60 on 17-03-2022 
6- Stochastic- %K(5) both lines are kissing in Over bought zone.
7- Stochastic:- %K(5)- 87.62 & %D(3)- 87.74.
8- In MACD- MACD line has intersected Average line upward and its both lines are rising in negative zone.
9- MACD(26,12)- -214.37 & EXP(9)- -450.59 & Divergence- 236.22

Conclusions from EOD chart analysis
(Stochastic & MACD)

Pull Back Rally continuation strongly after Wave-C recent bottom formation at 15671.5 and no indication of on going Pull Back Rally completion yet on EOD and intraday charts.

As MACD line has intersected Average line upward and its both lines are rising in negative zone therefore showing Upward trend formations but in Stochastic its both lines are kissing in Over bought zone therefore signalling Short Term correction beginning possibility also.

Nifty-EOD Chart Analysis
(Averages)
Nifty-EOD Chart (17-Mar-2022):-
Technical Patterns and Formations in EOD charts

1-Averages
A- 5-Day SMA is today at   16885
B- 21-Day SMA is today at  16740
C- 55-Day SMA is today at  17278
D- 100-Day SMA is today at 17380 
E- 200-Day SMA is today at 16997
 
Conclusions from EOD chart
analysis (Averages)

As Nifty closed above all Averages except 100-Day SMA(17380) at 17287.05 on 17-03-2022 therefore showing strength because closed well above Long Term Trend decider 200-Day SMA(16997),let Nifty to sustain above it then rally above life time highest will be considered after Wave-C completion confirmation at 15671.5. 

Nifty-Intra Day Chart Analysis
(17-Mar-2022)
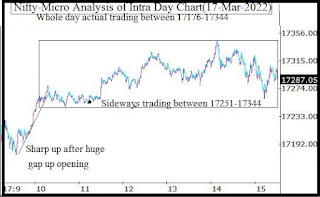
Nifty-Intra Day Chart (17-Mar-2022):-
Technical Patterns formation in today intraday charts

1- Sharp up after huge gap up opening
2- Sideways trading between 17251-17344
3- Whole day actual trading between 17176-17344

Conclusions from intra day chart analysis 

Although firstly sharp up after huge gap up opening but sideways trading was seen between 17251-17344 in last more than 4 hours therefore firstly sustaining beyond this range should be watched in the beginning of coming week for next decisive moves beginning. 

As selling patterns were not seen and consolidation patterns formations between 17251-17344 therefore firstly up moves are expected and complete selling is required for slipping and sustaining below 17251,let it happen then decisive down moves will be seen.

Conclusions
(After putting all studies together)

1- Short Term Trend is up.
2- Intermediate Term Trend is sideways.
3- Long Term Trend is sideways.

Although Short Term Trend is up but no confirmation of sustaining above 55 & 200-Day SMA therefore Intermediate & Long Term Trends will be considered sideways,let sustaining above both these SMA confirmation come then then these 2 Trends will be up.

MACD is showing Upward trend formations but in Stochastic its both lines are kissing in Over bought zone therefore signalling Short Term correction beginning possibility. As intraday charts have not shown selling patterns formations therefore on going Pull Back Rally will remain continued towards following next resistances in the beginning of next week:-

1- 17370-17417
2- 17580-17639 
3- 17648-17684
4- 17699-17731  
5- 17736-17761

Next supports of Nifty are as follows:-

1- 17185-17220
2- 16838-16943
3- 16559-16672

Firstly watch next resistances and failing to sustain above any one will confirm Short Term correction beginning towards above mentioned supports. More or less sideways market is expected within above mentioned supports and resistances if there is no big negative news from Russia-Ukraine war front.