Just watch next 2 levels for the life of on going correction
Technical Analysis,Research & Weekly Outlook
(Mar 02 to Mar 06,2020)
Nifty-EOD Chart Analysis
(Waves structure)
Nifty-EOD Chart (28-Feb-2020):-
 |
| Just click on chart for its enlarged view |
Technical Patterns and Formations in EOD charts
1- Impulsive Wave-1 beginning from 6825.80 on 29-02-2016 after 1 financial year(2015-16) correction completion.
2- Impulsive Wave-1 completion at 8968.70 on 07-09-2016 and corrective Wave-2 beginning
3- Corrective Wave-2 completion at 7893.80 on 26-12-2016 and impulsive Wave-3 beginning
4- Impulsive Wave-3 completion at 11760.20 on 28-08-2018 and corrective Wave-4 beginning
5- Corrective Wave-4 completion at 10004.55 on 26-10-2018 and impulsive Wave-5 beginning
6- Impulsive Wave-5 continuation with new life time high formation at 12430.50 on 20-01-2020
7- Wave-5 correction continuation with recent bottom formation at 11175.05 on 28-02-2020
Nifty-EOD Chart Analysis
(5th Wave structure)
Nifty-EOD Chart (28-Feb-2020):-
 |
| Just click on chart for its enlarged view |
Technical Patterns and Formations in EOD charts
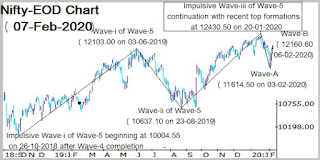
1- Impulsive Wave-i of Wave-5 beginning at 10004.55 on 26-10-2018 after Wave-4 completion
2- Wave-i of Wave-5 completion at 12103.00 on 03-06-2019 and corrective Wave-ii beginning
3- Corrective Wave-ii of Wave-5 completion at 10637.10 on 23-08-2019 and impulsive Wave-iii beginning
4- Impulsive Wave-iii of Wave-5 completion after life time top formations at 12430.50 on 20-01-2020 and ABC correction beginning
5- Wave-A completion at 11614.50 on 03-02-2020
6- Wave-B completion at 12246.70 on 14-02-2020
7- Wave-C continuation with recent bottom formation at 11175.05 on 28-02-2020
Nifty-EOD Chart Analysis
(Wave-iii of Wave-5 structure)
Nifty-EOD Chart (28-Feb-2020):-
 |
| Just click on chart for its enlarged view |
Technical Patterns and Formations in EOD charts
1- Corrective Wave-ii of Wave-5 completion at 10637.10 on 23-08-2019 and impulsive Wave-iii beginning
2- Impulsive Wave-iii of Wave-5 completion after life time top formations at 12430.50 on 20-01-2020 and ABC correction beginning
3- Wave-A completion at 11614.50 on 03-02-2020
4- Wave-B completion at 12246.70 on 14-02-2020
5- Wave-C continuation with recent bottom formation at 11175.05 on 28-02-2020
Conclusions from EOD chart analysis
(Waves structure)
Short and Intermediate Term Trends were already down and Long Term Trend has turned down on 28-02-2020 after forceful breaking down of its decider 200-Day SMA(today at 11687.20) but confirmation is required also through sustaining below it.
Conclusions from EOD chart analysis
(5th Wave structure)
Impulsive Wave-iii of Wave-5 completion after life time top formations at 12430.50 on 20-01-2020 and now Wave-C of its ABC correction correction continuation with recent bottom formation at 11175.05 on 28-02-2020 and no indication of its completion yet.
Conclusions from EOD chart analysis
(Wave-iii of Wave-5 structure)
Wave-iii of Wave-5 begun from 10637.10 on 23-08-2019 and and now its corrective Wave-C continuation with recent bottom formation at 11175.05 on 28-02-2020. As per Wave theory on going Wave-C correction should not slip below the beginning levels of Wave-iii of Wave-5(10637.10) otherwise whole Waves structure will be recounted which should be firstly watched in next week for the validity of Wave-iii of Wave-5 and life of ongoing correction.
Conclusions
(After Putting All Studies Together)
When Nifty was trading above 12100 then following conclusive line was told in the Weekly Outlook of Feb 17 to Feb 21,2020 with its topic name of "Strong signals of deeper correction beginning from next week"
correction is expected in next week which may be deeper also.
When Nifty was trading above 12000 then following conclusive line was told in the Weekly Outlook of Feb 24 to Feb 28,2020 with its topic name of "Correction continuation towards and below next supports"
First strong signal of deeper correction beginning will be after sustaining below 11909 and that will mean correction continuation towards and below 11615/11460.70 also which will be seen in the coming weeks/months.
As was told in both previous weekly outlooks 100% same happened and Nifty slipped more than 800 points after our above Outlooks and formed lowest at 11175.05 on 28-02-2020.
Next supports below last Friday lowest are between 11100-11144 which should be firstly watched in the coming week because once sustaining above it will mean strong signal of Wave-C correction completion because as per Waves structure Nifty should not slip below 10637.10 and once its happening will mean first signal of fresh rally beginning for moves above life time highest(12430.50).
As Short Term indicators have turned oversold therefore a sharp Pull Back Rally or "V Shaped recovery" may be seen any day and its confirmation will be after sustaining above next supports range(11100-11144).
Although correction is very much on and no indication of its completion yet but following 2 levels should be firstly watched in next week for the life of on going correction and its its importance has already been described above:-
1- 11100-11144
2- 10637.10


