ॐ ह्रीं श्रीं लक्ष्मीभयो नमः॥


Trading "calls" from our "Software" with more than "90% accuracy"

 This is the "Oldest & Only Website" of whole World
which is updating Nifty & Indian Stock Markets
"Daily and Weekly accurate Outlooks" 
with "Intraday Charts Analysis"for the 
last more than "14 years" means from "2010"
For its live Proofs just see "Archive"
in the "bottom of this Website".
Finally Rally continuation after follow up Consolidations in the coming Sessions 
Technical Analysis,Research & Weekly Outlook
(Mar 29 to Apr 01,2016)
Nifty-EOD Chart (28-Mar-2016):-
Just click on chart for its enlarged view
Technical Patterns and Formations in EOD charts

1- Pull Back Rally beginning after bottom formation at 6825.80 on 29-02-2016
2- Recent top of Pull Back rally formations at 7749.40 on 28-03-2016
3- Correction of Pull Back rally beginning with recent bottom formations at 7587.70 on 28-03-2016

Inverse Head And Shoulders formations

Nifty-EOD Chart (28-Mar-2016):-
Just click on chart for its enlarged view
Technical Patterns and Formations in EOD charts

1- Inverse Head And Shoulders pattern formations in 48 sessions with its Neckline at 7600
2- Head formation at 6825.80 on 29-02-2016 
3- Neckline broken out on 21-03-2016
4- Neckline broken down with closing above it on 28-03-2016 

Fibonacci Retracement levels of Post-Budget Rally

Nifty-EOD Chart (28-Mar-2016):-
Just click on chart for its enlarged view
Intra Day Chart Analysis(29-03-2016)

Nifty-Intra Day Chart (28-Mar-2016):-
Just click on chart for its enlarged view
Technical Patterns and Formations in today intraday charts

1- Whole day Down moves in Bullish Falling Channels
2- Supports between 7587-7610 
3- Whole day actual trading between 7587-7749

Conclusions (After Putting All Studies Together)

Pull Back Rally beginning on 29-02-2016 after Union Budget-2016 which remained continued without any deeper correction but strong intraday correction was seen on 28-03-2016 which will be seen according to following Fibonacci Retracement levels of Post-Budget Rally(6826-7749)

1- 13.0%- 7629(corrected)
2- 23.6%- 7531
3- 27.0%- 7499
4- 38.2%- 7396(Crucial)
5- 50.0%- 7287(Crucial)
6- 61.8%- 7178(Crucial)
7- 70.7%- 7096
8- 76.4%- 7043
9- 78.6%- 7023 
10-88.6%- 6931 

Inverse Head And Shoulders pattern formations in 48 sessions with its Neckline at 7600 and its Neckline was broken out on 21-03-2016 and Nifty remained above it in last 3 sessions of previous week but its Neckline was broken down with closing above it on 28-03-2016 therefore firstly sustaining beyond Neckline(7600) should be watched in the coming sessions because confirmation of sustaining above it will mean next target of Nifty at 8374.20. Just click following topic link to understand the calculations of mentioned target:-   


Certainly view will be cautious because today Nifty moved and closed below following levels in a single day today correction:- 

1- Last 3 sessions lowest(7618)
2- 13.0% retracement level(7629)

Next supports of Nifty are as follows:-

1- 7518-7568
2- 7410-7443
3- 7347-7375

Correction beginning today and no confirmation of its completion yet but whole day today Down moves were in Bullish Falling Channels and got supports also near about Neckline(7600) between 7587-7610 as well as today closing also above Neckline at 7615.10 therefore hopes are alive for fresh rally beginning after correction completion near about Neckline. 

As last 3 sessions levels broken down in today crash and more consolidation is required for decisive rally above today highest as well as more down moves in consolidation process can not be ruled out therefore firstly sustaining beyond following levels should be watched for today started correction completion:-

1- Firstly sustaining beyond today supports range(7587-7610) should be watched for today started correction completion. 
2- Finally 7518-7749 will decide the fate of Post Budget Pull Back Rally. 

Nifty will trade and prepare between 7518-7749 in the coming sessions of this week for post RBI Credit Policy next big moves and finally valid break out of this range will decide next Trend. Still expected that finally rally above today highest(7749) will remain continued in next week after follow up consolidations between 7518-7749 despite 101 points down moves today.   
Firstly watch valid break out of last 3 sessions trading range
Technical Analysis and Market Outlook
(28-03-2016)

As now out of station and will be able to reach my native place at 06:00 tomorrow therefore updating only tomorrow Outlooks without charts analysis.

Following lines were told at 09:46 AM on 23-03-2016 in "Post-open Outlook(23-03-2016)":- 

Next supports are between 7630-7670 which should be firstly watched today for the confirmation of today started down moves continuation/completion.

Supports between 7630-7670 were told and Nifty got support at 7670.60 that day as well as closed flat after some recovery from lower levels.

Next resistances of Nifty are as follows:-

1- 7766-7835
2- 7912-7960

Next supports of Nifty are as follows:-

1- 7630-7670
2- 7518-7568
3- 7410-7443
3- 7347-7375

As Bearish Hanging Man Candlestick formation on 23-03-2016 therefore view will be cautiously Bullish and firstly valid break out of last 3 sessions trading range(7618-7728) should be watched in the coming 1/2 sessions for next decisive moves confirmations.
Post-open Outlook(23-03-2016)

As all the Asian markets are trading in Red today and long Weekend ahead from tomorrow therefore sentiment is depressed today morning resultant weak opening of Indian markets. Next supports are between 7630-7670 which should be firstly watched today for the confirmation of today started down moves continuation/completion.

Still View is Bullish
Intra Day Chart Analysis & Market Outlook
(23-03-2016)
Nifty-Intra Day Chart (22-Mar-2016):-
Just click on chart for its enlarged view
Technical Patterns and Formations in today intraday charts

1- Most time trading below yesterday closing(7704.25)
2- High intraday volatility
3- Whole day actual trading between 7644-7728

Conclusions from intra day chart analysis 

Although Nifty closed near the higher levels of the day yesterday after gaining 100 points but we told following lines yesterday in "Rally continuation expectations after follow up consolidation":-

1- some volatility may be firstly seen for consolidation within today trading range
2- View was Bullish from and before Budget day and still same view as well as expected that Rally above 7600 will remain continued
2- 1/2 sessions follow up consolidation within of near about higher levels of today trading range

As was told yesterday, 100% same had been seen in following manner today:-

1- High volatility was seen today 
2- Nifty traded almost whole day within yesterday trading range(7628-7713) and closed little above it at 7714.90 today. 
3- Bullish view was told and and Nifty closed positive today

Although no clear pattern formation today and only high intraday volatility was seen but view will remain Bullish because selling patterns were also not seen and until complete selling patterns will not develop till then any correction will not develop,let it happen then will be considered.

Rally continuation expectations after follow up consolidation
Intra Day Chart Analysis & Market Outlook
(22-03-2016)

Nifty-Intra Day Chart (21-Mar-2016):-
Just click on chart for its enlarged view
Technical Patterns and Formations in today intraday charts

1- More than 4 hours trading with Mixed Patterns formations between 7629-7661
2- Up moves after recovery in European markets and Dow's Futures after 01:30 PM.
3- Whole day actual trading between 7628-7713

Conclusions from intra day chart analysis 

As first 4 hours trading with Mixed Patterns formations and last hours up moves on the back of European markets and US cues therefore some volatility may be firstly seen for consolidation within today trading range because European markets closed near the lower levels of the day after loosing all first 2 hours gains and Short Term Oscillators have also turned overbought after strong rally today.  

View was Bullish from and before Budget day and still same view as well as expected that Rally above 7600 will remain continued after 1/2 sessions follow up consolidation within of near about higher levels of today trading range
48 Sessions Bullish Pattern showing Nifty target at 8374.20
Technical Analysis,Research & Weekly Outlook
(Mar 21 to Mar 23,2016)

12 Months Correction with Bullish Flag formations

Nifty-EOD Chart (18-Mar-2016):-
Just click on chart for its enlarged view
Technical Patterns and Formations in EOD charts

1- Wave-3 on long Chart beginning at 5118.85 on 28-08-2013
2- Wave-3 completion and corrective Wave-4 beginning at 9119.20 on 04-03-2015 
3- Corrective Wave-4 recent bottom of correction at 6825.80 on 29-02-2016
4- 12 Months correction with Bullish Flag formations
5- Long Term Trend decider 200 Day EMA is today at 7781
6- Upper falling line of Bullish Flag is near 200 Day EMA 

Inverse Head And Shoulders formations

Nifty-EOD Chart (18-Mar-2016):-
Just click on chart for its enlarged view
Technical Patterns and Formations in EOD charts

1- Inverse Head And Shoulders pattern formations in last 48 sessions with its Neckline at 7600
2= Head formation at 6825.80 on 29-02-2016 

Pull Back Rally continuation

Nifty-EOD Chart (18-Mar-2016):-
Just click on chart for its enlarged view
Technical Patterns and Formations in EOD charts

1- Pull Back rally beginning after getting supports at 6825.80 on 29-02-2016
2- Recent top of Pull Back rally formations at 7613.60 on 18-03-2016
3- 10 Sessions sideways trading between 7406-7585
4- 10 Sessions range broken out with closing above it at 7604.35 on 18-03-2016 

Conclusions (After Putting All Studies Together)

Following conclusive lines were told in previous weekly Outlook on 13-03-2016 in "Finally Up moves after volatile trading within Crucial Levels":-

expected that in every situation(best to worst) Nifty will firstly trade between or near about 7310-7600 with high volatility and finally will move above 7600 decisively without sustaining below 7310.

As was told same happened in previous weekly Outlook,100% same happened and finally Nifty closed above 7600 with previous week lowest formation at 7405

Trends of Nifty are as follows:-

1- Short Term Trend has turned up after post budget Rally
2- Intermediate Term Trend is sideways which will be up after sustaining above 7600.
3- Long Term Trend is down which will be up after sustaining above its decider 200 Day EMA(today at 7781)

That Bullish Wave which started on 28-08-2013 from 5118.85 gained 4000 points and completed at 9119.20 on 04-03-2015 and after that its correction started which formed recent bottom at 6825.80 on 29-02-2016 then Pull Back rally begun which is in continuation with recent top formation at 7613.60 and no confirmation of its completion yet. 

12 Months correction from 9119.20 to 6826 is with Bullish Flag formations and Nifty has not slipped below its lower falling line as well as strong Pull Back Rally started from Budget-2016 day which is in continuation and no signal of its completion yet. As Bullish Flag is still valid therefore fresh rally hopes above all time high(9119.20) are still alive. 

Long Term Trend decider 200 Day EMA(today at 7781) and Upper falling line of Bullish Flag are near therefore once valid break out of 200 Day EMA will mean broken out confirmation of Bullish Flag also which will mean strong indication of 12 months correction completion at 6825.80 on 29-02-2016 and Indian markets are well prepared for fresh strong rally above life time high(9119.20).       

Following 2 Bullish developments last Friday:- 

1- 10 Sessions sideways trading between 7406-7585 and this range broken out and closing above it at 7604.35.
2- Inverse Head And Shoulders pattern formations in last 48 sessions with its Neckline at 7600 and closing above it at 7604.35. 

It is confirm that once sustaining above 7600 will mean Neckline broken out confirmation which will generate fresh blasting rally to test 8374.20 according to following calculations:- 

Head formation at 6825.80
Neckline of pattern is at 7600
7600-6825.80= 774.20 points distance between Head and Neckline 
Neckline was broken out on 18-03-2016 with closing at 7604.35 
Inverse Head and Shoulders Neckline broken out confirmation will mean next target of Nifty at 7600+774.20=8374.20

High possibility of fresh strong rally after sustaining above 7600 and Long Term Trend decider 200 Day EMA(today at 7781) as well as decisive up moves towards next strong resistances which are above 7890,also expected that Nifty will test above mentioned 48 Sessions Bullish Pattern target(8374.20) in the coming months.
Live proofs of 100% accurate Levels and Predictions

Following line was told today at 12:43 AM in "Firstly Sideways Market for More than 3% One Sided Big Moves Preparations":- 

view will not be Bearish despite today closing near the lower levels of the day.

Nifty closed at 7604.35 today after gaining 91.80 points and that proved our following prediction also 100% accurate which was done on 13-03-2016 in "Finally Up moves after volatile trading within Crucial Levels":- 

 expected that in every situation(best to worst) Nifty will firstly trade between or near about 7310-7600 with high volatility and finally will move above 7600 decisively without sustaining below 7310

Just click following topic link also and verify those live proofs on your own in which we told more than 5 times for each Post FOMC Rally & Post Budget Bullish Indian Markets. As was predicted in the links of this topic all that was exactly seen immediately after these 2 events in March 2016:-

Firstly Sideways Market for More than 3% One Sided Big Moves Preparations
Intra Day Chart Analysis & Market Outlook
(18-03-2016)
Nifty-Intra Day Chart (17-Mar-2016):-
Just click on chart for its enlarged view
Technical Patterns and Formations in today intraday charts

1- 5 Hours Mixed Patterns between 7542-7585
2- Down moves in last hours
3- Whole day actual trading between 7480-7585

Conclusions from intra day chart analysis 

As Stock markets favouring announcements by FOMC and resultant all the Asian markets were trading strong therefore gap up opening of Indian markets but not sustaining at higher levels and closing near the levels of the day after loosing more than 100 points from higher levels because:-

1- As such consolidation patterns were not seen and first 5 Hours trading was with Mixed Patterns formations.
2- Indian markets under performed Asian markets and some selling was seen.
3- Real down moves started after 02:00 PM because:- 
A- Dow's Futures slipped  120 points between 02:00 PM and 03:30 PM today and started recovering within 30 minutes after Indian markets closing.
B- All the European markets started to slip after 02:00 PM today and begun recovering within 30 minutes after Indian markets closing.

Following resistances were updated on 14-03-2016 in "Still Decisive Up Moves Expectations" and also updated many times earlier:-

1- 7500-7543
2- 7556-7600(strong resistances)

As more than 5 hours today trading within above mentioned resistance ranges with Mixed Patterns formations and strong resistances are also lying between 7556-7600 therefore firstly Nifty has to consolidate for decisive up moves above 7600. Good supports above 7405 and equally good resistances below 7600 therefore Nifty will trade sideways and prepare for next decisive moves between 7405-7600 in the coming 1/2 sessions. 

Last 10 sessions trading between 7405-7585 and resistances are up to 7600 therefore it is confirm that valid break out of 7405-7600 will produce more than 3% one sided big moves. As Mixed patterns formations between 7542-7585 today therefore sustaining it beyond will be first indication and should be firstly watched.

As today last hours down moves were on the back of Dow's Futures and European markets therefore view will not be Bearish despite today closing near the lower levels of the day. Valid break out of above mentioned crucial levels should be firstly watched because Nifty has to prepare for next big decisive moves within and near about these levels.
We booked Profit in 1st Minute Today
Although market closed near the lower levels of the day and once also lost more than 100 points today but it should not be understood that market has deceived us because we booked profit in first minute of our buying positions.

As we always talk with those proofs which no one can deny therefore updating life proofs of calls with SMS pictures for showing that we booked our profit in 1st minute at the top of the day today:-

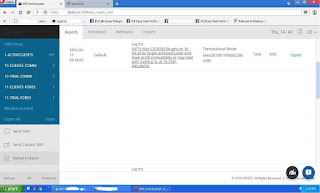
SMS No 1- At 01:40 PM on 16-03-2016-NIFTY-Mar CE(7600)-Buy-Positional-SL-14 & TGT-74-CMP-39(least risky before FOMC)(Lalit39)
SMS No 2- At 09:16 AM on 17-03-2016- NIFTY-Mar CE(7600)-Bought on 16-03-2016-Target achieved,Cover and book profit immediately or may hold with trailling SL at 74-CMP-84(Lalit39)

We always send 2 SMS for each and every call from those fastest websites which deliver SMS within 15 seconds. As we always talk with those proofs which no one can deny therefore updating following live proofs of above mentioned SMS pictures which were sent by us:-

1- SMS No 1 from 1st Website(Trading SMS):-
Just click on above picture for enlarged view of those SMS which were sent by us
2- SMS No 1 from 2nd Website(Trading SMS):-
Just click on above picture for enlarged view of those SMS which were sent by us
3- SMS No 2 from 1st Website(Covering SMS):-
Just click on above picture for enlarged view of those SMS which were sent by us
4- SMS No 2 from 2nd Website(Covering SMS):-
Just click on above picture for enlarged view of those SMS which were sent by us
(As in hurry we sent 2nd covering message wrong(ICICI link was sent) therefore we sent sorry message also after sending covering SMS today)

If unable to read  text in above picture then:-

1- Firstly click on above SMS picture and enlarge it.
2- If unable to read then Save picture on yours desktop and after that  
3- Open and again enlarge the picture in Windows Picture Viewer.

Only 2 following information are deleted in above SMS Picture due to official secrecy rules:-

1- Numbers of sent SMS.
2- SMS sending Website name.

As we always send 2 SMS for each and every trading call and  2 SMS for each its covering therefore Wherever Our clients are moving they need not to watch market and only have to keep Mobile in their pocket because in any worst condition also minimum 1 SMS will be delivered and our clients will be able to trade and cover without any delay.

We always talk with only those proofs which no one can deny therefore live proofs have been updated and even though if anyone has any doubt then may call us and then he will be given the Mobile Numbers of those who enjoyed profits from any part in India.
Except us who told in whole India
for 
Post FOMC Rally
&
Post Budget Bullish Indian Markets 

Nifty traded 84 points up at 7582.90 within first 3 minutes after opening today but when Nifty was trading at much lower levels in previous sessions then also we told for Post FOMC Rally which is being seen today

Live proofs of our 100% accurate predictions of  Post FOMC Rally are as follows:-

Following lines were told on 16-03-2016 in "Post FOMC Rally on Cards":- 

rally continuation is expected after post FOMC announcements tomorrow

Following lines were told on 15-03-2016 in "Post FOMC Up Moves after Follow up Consolidation":- 

Post FOMC up moves after follow up consolidation is being continuously projected since last Friday still holding same view

Following lines were told on 14-03-2016 in "Still Decisive Up Moves Expectations":- 

1- decisive up moves will be seen above 7600 after FOMC announcements on 16th March Mid night.
2- still same view of decisive up moves expectations above 7600

Following lines were told at 12:35 PM on 14-03-2016 in "Mid-session Outlook(14-03-2016)":- 

1- expected that Nifty will trade and prepare between 7405-7600 for post FOMC decisive big moves
2- still same finally Up moves view which was updated yesterday in previous Outlook.

Following lines were told on 13-03-2016 in "Finally Up moves after volatile trading within Crucial Levels":- 

 expected that in every situation(best to worst) Nifty will firstly trade between or near about 7310-7600 with high volatility and finally will move above 7600 decisively without sustaining below 7310

Live Proofs of Post Budget Bullish Indian Markets Predictions

Just Click following topic link and verify on yours own our 100% accurate predictions of Post Budget Rally which were done only by us in whole India:-


Archive(More than 7000 Topics) at the left bottom of this Blog is life proof of such accurate predictions of Indian Stock Markets for the last 5 years. Anyone can verify this fact any time from EOD and intraday charts of last 5 years
Post FOMC Rally on Cards
Intra Day Chart Analysis & Market Outlook
(17-03-2016)
Nifty-Intra Day Chart (16-Mar-2016):-
Just click on chart for its enlarged view
Technical Patterns and Formations in today intraday charts

1- Consolidation between 7405-7531(Immediate Supports)
2- Up moves with intraday corrections
3- Whole day actual trading between 7405-7508

Conclusions from intra day chart analysis 

Live proofs of Levels and Nifty predictions 
100% accuracy

Following lines were told at 12:35 PM on 14-03-2016 in "Mid-session Outlook(14-03-2016)":- 

expected that Nifty will trade and prepare between 7405-7600 for post FOMC decisive big moves

As was told 100% same happened in following manner previous 3 sessions:-

1- Lower level was given at 7405 and lowest formation at 7405.15 today before 102 points rally.
2- Trading and preparing for post FOMC decisive big moves was told between 7405-7600 on 14-03-2016 and after that Nifty traded within this range between 7405.15-7583.70 till today.

As firstly consolidation between 7405-7531 today and after that strong rally in last hours with intraday corrections therefore today started rally continuation is expected after post FOMC announcements tomorrow because selling patterns were not seen in last 2 sessions but all the down moves from 7583 were in Bullish Falling Channels
Post FOMC Up Moves after Follow up Consolidation
Intra Day Chart Analysis & Market Outlook
(16-03-2016)
Nifty-Intra Day Chart (15-Mar-2016):-
Just click on chart for its enlarged view
Technical Patterns and Formations in today intraday charts

1- Consolidation Patterns between 7503-7525
2- Down moves in Bullish Falling Channels
3- Whole day actual trading between 7453-7525

Conclusions from intra day chart analysis

Although whole day down moves were seen today but its happening with volatility and post FOMC up moves are being updated continuously in following lines from last Friday:-

Following lines were told at 02:43 PM on 11-03-2016 in "Pre-closing Outlook(11-03-2016)":- 

1- Although above Bullishness but today intraday charts are showing selling signals
2- down moves are expected in the beginning of next week. 
3- Valid break out of 7430-7530 will be first indication and sustaining beyond or forceful break out of 7310-7600 will be confirmation post FOMC big moves. 

Following lines were told on 13-03-2016 in "Finally Up moves after volatile trading within Crucial Levels":- 

1- selling was also seen between 7405-7545 in last 6 sessions therefore Indian markets may be highly volatile in the beginning of next week. 
2- selling was seen last Friday also therefore some down moves are expected between last 6 sessions range
3- expected that in every situation(best to worst) Nifty will firstly trade between or near about 7310-7600 with high volatility and finally will move above 7600 decisively without sustaining below 7310. 

Following lines were told at 12:35 PM on 14-03-2016 in "Mid-session Outlook(14-03-2016)":- 

1- Last Friday Selling and last 6 sessions selling 
2- expected that Nifty will trade and prepare between 7405-7600 for post FOMC decisive big moves

Following lines were told on 14-03-2016 in "Still Decisive Up Moves Expectations":- 

1- Although whole day continuous down moves but in Bullish Falling Channels therefore consolidation process continuation will be understood.
2- Detailed analysis have already been updated in both previous Outlooks and still same view of decisive up moves expectations above 7600

Down moves were clearly told in the beginning of this week and Nifty slipped 130 points from higher levels in last 2 sessions. Post FOMC up moves after follow up consolidation was also told in previous Outlooks and it is still expected because consolidation patterns formations in first hour today and Down moves in Bullish Falling Channels were also seen in last 2 sessions which is also a consolidation pattern.

Post FOMC up moves after follow up consolidation is being continuously projected since last Friday still holding same view despite following Following Global markets weakness at this moment:-

1- All the European markets are now trading .67% to 1.21% down.
2- Dow's Futures is now trading 95 points down.
3- All the Asian markets closed in Red except China.
Still Decisive Up Moves Expectations
Intra Day Chart Analysis & Market Outlook
(15-03-2016)
Nifty-Intra Day Chart (14-Mar-2016):-
Just click on chart for its enlarged view
Technical Patterns and Formations in today intraday charts

1- Down moves in Bullish Falling Channels
2- Whole day actual trading between 7516-7583

Conclusions from intra day chart analysis 

Following resistances of Nifty were updated yesterday in "Finally Up moves after volatile trading within Crucial Levels":-

1- 7500-7543
2- 7556-7600(strong resistances)

As all the Global markets were blasting therefore strong opening of Indian markets but could not sustain at higher levels because:-

1- Strong resistances were told between 7556-7600 and Nifty retraced after intraday highest formation within this range at 7583.70
2- Selling was seen between 7405-7545 in last 6 sessions and follow up selling developed last Friday also therefore Nifty could not sustain above it because complete consolidation was required for decisive up moves above last 6 sessions highest(7545)

Although whole day continuous down moves but in Bullish Falling Channels therefore consolidation process continuation will be understood. If it remains continued in the coming sessions then decisive up moves will be seen above 7600 after FOMC announcements on 16th March Mid night.

Detailed analysis have already been updated in both previous Outlooks and still same view of decisive up moves expectations above 7600 despite today closing near the lower levels of the day.
Mid-session Outlook(14-03-2016)

Although US markets and all the European markets blasted last Friday but we were cautious and not as such Bullish therefore told following lines yesterday in "Finally Up moves after volatile trading within Crucial Levels":-

1- 6 Sessions actual trading between 7405-7545 
2- selling was also seen between 7405-7545 in last 6 sessions therefore Indian markets may be highly volatile in the beginning of next week.
3- selling was seen last Friday also therefore some down moves are expected between last 6 sessions range

All the Asian markets were also blasting today morning and Nifty also moved up 73 points in first 15 minutes but could not sustain at higher levels and slipped below 7545 at 7526 after loosing 57 points from higher levels because Last Friday Selling and last 6 sessions selling as well.

volatility in the beginning of this week was also told which was seen in first 3 hours today. Although Nifty is now trading after loosing 57 points from higher levels but expected that Nifty will trade and prepare between 7405-7600 for post FOMC decisive big moves. Although more than 57 points slipping from higher levels today but still same finally Up moves view which was updated yesterday in previous Outlook.
Finally Up moves after volatile trading within Crucial Levels
Technical Analysis,Research & Weekly Outlook
(Mar 14 to Mar 18,2016)

Waves Structure of Post Budget-2015 Correction

Nifty-EOD Chart (11-Mar-2016):-
Just click on chart for its enlarged view

Technical Patterns and Formations in EOD charts

1- Wave-5 completion at 9119.20 on 04-03-2015 and Wave-A of 'ABC' correction beginning after life time high formation)
2- Wave-1 of Wave-A(8269.15 on 27-03-2015)
3- Wave-2 of Wave-A(8844.40 on 15-04-2015)
4- Wave-3 of Wave-A(7997.15 on 07-05-2015)
5- Wave-4 of Wave-A(8489.55 on 22-05-2015)
6- Wave-5 of corrective Wave-A completion(7940.30 on 12-06-2015) and Wave-B beginning
7- Wave-B completion and corrective Wave-C beginning(8654.75 on 23-07-2015)
8- Wave-1 of Wave-C(7539.50 on 08-09-2015)
9- Wave-2 of Wave-C(8336.30 on 26-10-2015)
10- Recent bottom of Wave-3 of Wave-C formation at 6825.80 on 29-02-2016 and Pull Back Rally beginning
11- Recent top of Pull Back rally formations at 7547.10 on 10-03-2016
12- Long Term Trend decider 200 Day EMA is today at 7794


Waves Structure of Post Budget-2016 Pull Back Rally

Nifty-EOD Chart (11-Mar-2016):-
Just click on chart for its enlarged view
Technical Patterns and Formations in EOD charts

1- Pull Back rally beginning after getting supports at 6825.80 on 29-02-2016
2- Recent top of Pull Back rally formations at 7547.10 on 10-03-2016
3- 6 Sessions sideways trading between 7406-7547

Previous 6 Sessions intraday charts analysis

Nifty-Intra Day Chart (Mar 03 to Mar 11,2016):-
Just click on chart for its enlarged view
Technical Patterns and Formations in last 6 Sessions intraday charts

1- 6 Sessions actual trading between 7405-7545 
2- Both buying and selling patterns formations in last 6 sessions.

Intra Day Chart Analysis(11-03-2016)

Nifty-Intra Day Chart (11-Mar-2016):-
Just click on chart for its enlarged view
Technical Patterns and Formations in today intraday charts

1- Selling between 7527-7543
2- Selling between 7505-7524
3- Whole day actual trading between 7460-7543

Conclusions (After Putting All Studies Together)

Live Proofs of Levels Accuracy

Although strong rally begun after Budget but we were not as such Bullish for this week therefore posted following weekly analysis topic at 06:17 PM on 04-03-2016:-


Nifty traded most time within mentioned 68 points range(7444-7512) and closed also between this range at 7510.20 with whole previous week trading between 7424-7546.

Trends of Nifty are as follows:-

1- Short Term Trend has turned up after post budget Rally
2- Intermediate Term Trend is down which will be up above 7600 
3- Long Term Trend is down which will be up after moving above its decider 200 Day EMA(today at 7794)

The correction which started from 9119.20 on 04-03-2015 got last support at 6825.80 on 29-02-2016 and Pull Back Rally begun which is in continuation and no confirmation of its completion yet. Last 6 Sessions sideways trading between 7406-7547 with both buying and selling patterns formations within that range. 

Next supports of Nifty are as follows:-

1- 7405-7466
2- 7310-7360

Next resistances of Nifty are as follows:-

1- 7500-7543
2- 7556-7600(strong resistances)

As US and European markets closed strong with 1.28% to 3.27% gains last Friday and FOMC meeting on 15th and 16th March as well as selling was also seen between 7405-7545 in last 6 sessions therefore Indian markets may be highly volatile in the beginning of next week. As selling was seen last Friday also therefore some down moves are expected between last 6 sessions range but finally next trend will get confirmation from following crucial levels:-

1- 7405-7543(First indication)
2- 7310-7600(Final confirmation)

Although valid break out of above crucial levels should be firstly watched in next week but expected that in every situation(best to worst) Nifty will firstly trade between or near about 7310-7600 with high volatility and finally will move above 7600 decisively without sustaining below 7310
Pre-closing Outlook(11-03-2016)

Following Bullish moves at this moment:-

1- Nifty is now 22 points up
2- Sensex is now 103 points up
3- Dow's Futures is now 155 points up
4- All the European markets are also trading with 1.4% to 2.5% gains

Although above Bullishness but today intraday charts are showing selling signals therefore down moves are expected in the beginning of next week. As most uncertain Global markets therefore same following cautious view which has already been updated in previous 2 Outlooks at 08:57 AM and 01:57 PM today.

Valid break out of 7430-7530 will be first indication and sustaining beyond or forceful break out of 7310-7600 will be confirmation post FOMC big moves. 
Mid-session Outlook(11-03-2016)

As lower levels supports and some consolidation in last hours yesterday therefore Post Budget Rally continuation above yesterday highest(7547.10) was told yesterday in "Post Budget Rally continuation after follow up consolidation" and it was seen also with 56 points rally up to 7543.95 in first hour today.

As ECB news led European markets huge down moves and high volatility in US markets as well as Next resistances between 7500-7530 therefore following line was told today at 08:57 AM in "Sideways market for FOMC big Moves" and must be kept in mind:- 

Valid break out of 7430-7530 will be first indication and sustaining beyond or forceful break out of 7310-7600 will be confirmation post FOMC big moves. 


Although Nifty is now trading at 7512 after gaining 25 points but still we are saying for confirmations though above given levels.
Sideways market for FOMC big Moves
Pre-open Outlook(11-03-2016)

As ECB unexpectedly cut the bank’s key lending rate therefore deep Red closing of all European markets and flat closing of US markets amid high intraday volatility yesterday resultant most Asian markets are trading flat at this moment today. As FOMC meeting on 14 and 15 March therefore expected that all the Global markets including Indian markets will prepare for post FOMC meet decisive moves on 16th March.

Next supports of Nifty are as follows:-

1- 7430-7466
2- 7310-7360

Next resistances of Nifty are as follows:-

1- 7500-7530
2- 7556-7600

As huge fall in European markets and high volatility in US markets yesterday after ECB announcements therefore expected that Global markets will be cautious before FOMC and Nifty will also firstly remain sideways between 7430-7530 as well as prepare for post FOMC decisive big moves. Valid break out of 7430-7530 will be first indication and sustaining beyond or forceful break out of 7310-7600 will be confirmation post FOMC big moves.
Post Budget Rally continuation after follow up consolidation
Intra Day Chart Analysis & Market Outlook
(11-03-2016)
Nifty-Intra Day Chart (10-Mar-2016):-
Just click on chart for its enlarged view
Technical Patterns and Formations in today intraday charts

1- Selling between 7500-7530
2- Support between 7448-7466
3- Consolidation between 7477-7505
4- Whole day actual trading between 7448-7530

Conclusions from intra day chart analysis 


Following line was told yesterday in "Post Budget Rally Continuation after Minor Correction"

firstly minor 1/2 sessions correction may be seen 

Following lines were told at 11:04 AM today in "Post-open Outlook(10-03-2016)":-

Next supports are between 7430-7446

Firstly minor correction was told yesterday and it was seen through through whole day day negative zone trading and 45.65 points down closing today. Next supports are between 7430-7446 was told at 11:04 AM today and Nifty could not slip below it and today lowest remained just above it at 7447.40.

As lower levels supports and some consolidation in last hours today therefore expected that Post Budget Rally will remain continued above today highest(7547.10) but some follow up consolidation is also required within or near about 7500-7530 because some selling was seen between this range in first hour today.