More than 1.5% down today after last Friday higher levels selling. Intraday charts of today are showing again selling today also therefore Nifty is trading within strong and crucial support range(5172-5200),firstly sustaining it beyong should be watched today.

ॐ ह्रीं श्रीं लक्ष्मीभयो नमः॥

Finally impulsive wave-3 Rally in Coming Weeks
Technical Analysis,Research & Weekly Outlook
(Mar 26 to Mar 30,2012)
Technical Analysis and Research of EOD charts,Micro Analysis of Nifty Intra Day Chart,Technical Positions,next possibilities have already been explained in following topics with 3 Charts therefore not being repeated. Just click following topic links and go through detailed analysis for trading in next week:-
1-Finally impulsive wave-3 Rally after Correction Completion
2-Long Term Trend Decider 200-Day EMA & 200-Day SMA
3-Nifty-Micro Analysis of Intra Day Chart(23-Mar-2012)
Conclusions (After Putting All Studies Together)
Long term trend is up,Intermediate term and Short term trends are down in Intermediate term correction. 1098.80 Nifty Points rally in 45 sessions and its correction is on from 22-02-2012 but without any reversal pattern and Continuation pattern 'Symmetrical triangle' formation is visible in 23 sessions correction EOD Chart therefore expected that rally begun from 4531.15 on 20-12-2011 will continue after on going correction completion.
Correction is on after good selling at higher levels. Although good support seen above 5200 in previous week but correction is on and in this precess testing possibility of Long term trend decider 200-Day SMA(5156) can not be ruled out and until Nifty will not sustain below it till then Uptrend will remain intact.
Expected that Nifty will trade between 5156-5380 in the coming week and will prepare for fresh rally as well as Nifty will not sustain below 200-Day SMA and finally impulsive wave-3 rally will be seen after completion of corrective Wave-2.
Nifty-Micro Analysis of Intra Day Chart(23-Mar-2012)
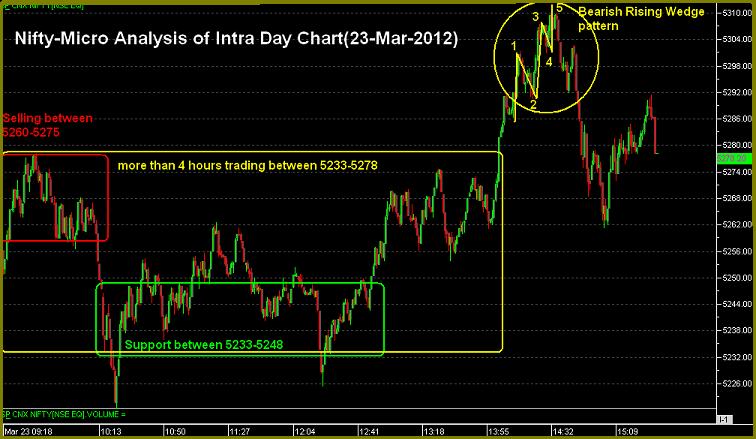
Nifty-Intra Day Chart(23-Mar-2012):-
Technical Patterns and Formations in today intraday charts
1- Selling between 5260-5275
2- Support between 5233-5248
3- Break out after more than 4 hours trading between 5233-5278
4- Bearish Rising Wedge pattern formations at the top.
3- Whole day trading between 5222-5312
Firstly more than 4 hours trading between 5233-5278 with mixed intraday patterns and then break out after European markets positive opening but failed to sustain at higher levels after Bearish Rising Wedge pattern formations and slipped.
Higher levels selling,lower levels support and next trend confirmations will be sustaining beyond today trading range(5222-5312) therefore it should be firstly watched in next week.
 |
| Just click on chart for its enlarged view |
1- Selling between 5260-5275
2- Support between 5233-5248
3- Break out after more than 4 hours trading between 5233-5278
4- Bearish Rising Wedge pattern formations at the top.
3- Whole day trading between 5222-5312
Conclusions from intra day chart analysis
Firstly more than 4 hours trading between 5233-5278 with mixed intraday patterns and then break out after European markets positive opening but failed to sustain at higher levels after Bearish Rising Wedge pattern formations and slipped.
Higher levels selling,lower levels support and next trend confirmations will be sustaining beyond today trading range(5222-5312) therefore it should be firstly watched in next week.
Finally impulsive wave-3 Rally after Correction Completion
Nifty-EOD Chart(23-Mar-2012):-
Technical Patterns and Formations in EOD charts
1- Bottom of 13 months correction at 4531.15 on 20-12-2011
2- Wave-1 completion at 5629.95 on 22-02-2012
3- Corrective Wave-2 bottom at 5171.45 on 07-03-2012
4- Continuation pattern Symmetrical triangle Formation
Correction is on but no reversal pattern visible. As Continuation pattern Symmetrical triangle formation seen therefore expected that finally impulsive wave-3 rally will be seen after completion of corrective Wave-2.
 |
| Just click on chart for its enlarged view |
1- Bottom of 13 months correction at 4531.15 on 20-12-2011
2- Wave-1 completion at 5629.95 on 22-02-2012
3- Corrective Wave-2 bottom at 5171.45 on 07-03-2012
4- Continuation pattern Symmetrical triangle Formation
Conclusions from EOD chart analysis
Correction is on but no reversal pattern visible. As Continuation pattern Symmetrical triangle formation seen therefore expected that finally impulsive wave-3 rally will be seen after completion of corrective Wave-2.
Long Term Trend Decider 200-Day EMA & 200-Day SMA
Nifty-EOD Chart(23-Mar-2012):-
Technical Patterns and Formations in EOD charts
1- Resistances at 200-Day SMA
2- Support at 200-Day SMA on 07-03-2012 at 5171.45
3- Support at 200-Day EMA on 22-03-2012 at 5206
4- 200-Day EMA is at 5204 on 23-03-2012
5- 200-Day SMA is at 5156 on 23-03-2012
Corrective Wave-2 is on and Intermediate and Short Term Trends are down. As Nifty is sustaining above 200-Day EMA & SMA therefore Long term trend is up,until Nifty is above till then Bullish markets survival hopes are alive.
It is clear from above EOD Chart that when Indian market was in Bear phase then each time Nifty faced resistances and retraced from 200-Day EMA & SMA. Nifty traded whole previous week above 200-Day EMA as well as tested it also but got support and sustained above.
Correction is on and its completion confirmation is required yet. Although Petroleum Price hike news is possible any day but sustaining below 5157 should be firstly watched tomorrow for Long Term Trend survival confirmations and until Nifty will not sustain below it till then Uptrend will remain intact.
Expected that finally Nifty will not sustain below 200-Day SMA and impulsive Wave-3 will continue after on going Wave-2 correction completion.
 |
| Just click on chart for its enlarged view |
1- Resistances at 200-Day SMA
2- Support at 200-Day SMA on 07-03-2012 at 5171.45
3- Support at 200-Day EMA on 22-03-2012 at 5206
4- 200-Day EMA is at 5204 on 23-03-2012
5- 200-Day SMA is at 5156 on 23-03-2012
Conclusions from EOD chart analysis
Corrective Wave-2 is on and Intermediate and Short Term Trends are down. As Nifty is sustaining above 200-Day EMA & SMA therefore Long term trend is up,until Nifty is above till then Bullish markets survival hopes are alive.
It is clear from above EOD Chart that when Indian market was in Bear phase then each time Nifty faced resistances and retraced from 200-Day EMA & SMA. Nifty traded whole previous week above 200-Day EMA as well as tested it also but got support and sustained above.
Correction is on and its completion confirmation is required yet. Although Petroleum Price hike news is possible any day but sustaining below 5157 should be firstly watched tomorrow for Long Term Trend survival confirmations and until Nifty will not sustain below it till then Uptrend will remain intact.
Expected that finally Nifty will not sustain below 200-Day SMA and impulsive Wave-3 will continue after on going Wave-2 correction completion.

FII & DII trading activity in Capital Market Segment on 23-Mar-2012
| ||||||||||||||||
| ||||||||||||||||
Indian Stock Markets Closing Reports(23-Mar-2012)
Main features of today trading are as follows
1- All the Indices closed in Green except Metals.
2- White Candle.
3- Whole day positive market.
Ratios
Nifty Put Call Ratio: 1.25
Nifty P/E Ratio(23-Mar-2012): 18.65
Advances & Declines
BSE Advances : 1430
BSE Declines : 1484
NSE Advances : 764
NSE Declines : 666
Nifty Open Interest Changed Today
Nifty- 5100 CE(Mar)- -59850(-4.83%)
Nifty- 5100 PE(Mar)- +1555950(+26.81%)
Nifty- 5200 CE(Mar)- +265950(+7.01%)
Nifty- 5200 PE(Mar)- +1897250(+27.92%)
Nifty- 5300 CE(Mar)- +488200(+11.00%)
Nifty- 5300 PE(Mar)- +224350(+4.48%)
Nifty- 5400 CE(Mar)- -334350(-5.01%)
Nifty- 5400 PE(Mar)- +24450(+0.69%)
Closing
Nifty- closed at 5,278.20(+49.75 Points & +0.95%)
Sensex- closed at 17,361.74(+165.27 Points & +0.96%)
CNX Midcap - closed at 7,671.40(+60.50 Points & +0.79%)
BSE Smallcap- closed at 6,626.35(+26.66 Points & +0.40%)
Nifty Spot-Levels & Trading Strategy for 26-03-2012
Nifty Spot-Levels
R3 5412
R2 5362
R1 5320
Avg 5270
S1 5228
S2 5178
S3 5136
Nifty Spot-Trading Strategy
H6 5371 Trgt 2
H5 5349 Trgt 1
H4 5328 Long breakout
H3 5303 Go Short
H2 5294
H1 5286
L1 5269
L2 5261
L3 5252 Long
L4 5227 Short Breakout
L5 5206 Trgt 1
L6 5184 Trgt 2
R3 5412
R2 5362
R1 5320
Avg 5270
S1 5228
S2 5178
S3 5136
Nifty Spot-Trading Strategy
H6 5371 Trgt 2
H5 5349 Trgt 1
H4 5328 Long breakout
H3 5303 Go Short
H2 5294
H1 5286
L1 5269
L2 5261
L3 5252 Long
L4 5227 Short Breakout
L5 5206 Trgt 1
L6 5184 Trgt 2
Nifty(Mar Fut)-Levels & Trading Strategy for 26-03-2012
Nifty(Mar Fut)-Levels
R3 5428
R2 5378
R1 5331
Avg 5281
S1 5234
S2 5184
S3 5137
Nifty(Mar Fut)-Trading Strategy
H6 5383 Trgt 2
H5 5360 Trgt 1
H4 5338 Long breakout
H3 5311 Go Short
H2 5302
H1 5293
L1 5276
L2 5267
L3 5258 Long
L4 5231 Short Breakout
L5 5209 Trgt 1
L6 5187 Trgt 2
R3 5428
R2 5378
R1 5331
Avg 5281
S1 5234
S2 5184
S3 5137
Nifty(Mar Fut)-Trading Strategy
H6 5383 Trgt 2
H5 5360 Trgt 1
H4 5338 Long breakout
H3 5311 Go Short
H2 5302
H1 5293
L1 5276
L2 5267
L3 5258 Long
L4 5231 Short Breakout
L5 5209 Trgt 1
L6 5187 Trgt 2
Bank Nifty(Mar Fut)-Levels & Trading Strategy for 26-03-2012
Bank Nifty(Mar Fut)-Levels
R3 10751
R2 10595
R1 10453
Avg 10297
S1 10155
S2 9999
S3 9857
Bank Nifty(Mar Fut)-Trading Strategy
H6 10614 Trgt 2
H5 10544 Trgt 1
H4 10474 Long breakout
H3 10392 Go Short
H2 10365
H1 10338
L1 10283
L2 10256
L3 10229 Long
L4 10147 Short Breakout
L5 10077 Trgt 1
L6 10008 Trgt 2
R3 10751
R2 10595
R1 10453
Avg 10297
S1 10155
S2 9999
S3 9857
Bank Nifty(Mar Fut)-Trading Strategy
H6 10614 Trgt 2
H5 10544 Trgt 1
H4 10474 Long breakout
H3 10392 Go Short
H2 10365
H1 10338
L1 10283
L2 10256
L3 10229 Long
L4 10147 Short Breakout
L5 10077 Trgt 1
L6 10008 Trgt 2
Nifty Spot-Weekly Levels & Trading Strategy(Mar 26 to Mar 30,2012)
Nifty Spot-Weekly Levels
R3 5554
R2 5470
R1 5374
Avg 5290
S1 5194
S2 5110
S3 5014
Nifty Spot-Weekly Trading Strategy
H6 5460 Trgt 2
H5 5418 Trgt 1
H4 5377 Long breakout
H3 5327 Go Short
H2 5311
H1 5294
L1 5261
L2 5245
L3 5228 Long
L4 5179 Short Breakout
L5 5137 Trgt 1
L6 5095 Trgt 2
R3 5554
R2 5470
R1 5374
Avg 5290
S1 5194
S2 5110
S3 5014
Nifty Spot-Weekly Trading Strategy
H6 5460 Trgt 2
H5 5418 Trgt 1
H4 5377 Long breakout
H3 5327 Go Short
H2 5311
H1 5294
L1 5261
L2 5245
L3 5228 Long
L4 5179 Short Breakout
L5 5137 Trgt 1
L6 5095 Trgt 2
Bank Nifty Spot-Weekly Levels & Trading Strategy(Mar 26 to Mar 30,2012)
Bank Nifty Spot-Weekly Levels
R3 11002
R2 10793
R1 10544
Avg 10335
S1 10086
S2 9877
S3 9628
Bank Nifty Spot-Weekly Trading Strategy
H6 10760 Trgt 2
H5 10653 Trgt 1
H4 10546 Long breakout
H3 10420 Go Short
H2 10378
H1 10336
L1 10253
L2 10211
L3 10169 Long
L4 10043 Short Breakout
L5 9936 Trgt 1
L6 9829 Trgt 2
R3 11002
R2 10793
R1 10544
Avg 10335
S1 10086
S2 9877
S3 9628
Bank Nifty Spot-Weekly Trading Strategy
H6 10760 Trgt 2
H5 10653 Trgt 1
H4 10546 Long breakout
H3 10420 Go Short
H2 10378
H1 10336
L1 10253
L2 10211
L3 10169 Long
L4 10043 Short Breakout
L5 9936 Trgt 1
L6 9829 Trgt 2
Pre-Closing Outlook(23-03-2012)
More than 4 hours trading between 5233-5278 and after that break out after European markets positive opening but failed to sustain at higher levels and slipped into mentioned range after Bearish Rising Wedge pattern formations.
Although positive closing expected after almost whole day Green trading higher levels selling patterns also therefore until Nifty will not sustain above todays highs(5312) till then any sustained up move will not be considered.
Higher levels selling,lower levels support today and next trend confirmations will be sustaining beyond today trading range therefore will be firstly watched in next week.
Mid-session Outlook(23-03-2012)
Nifty traded most time between 5233-5278 with higher levels selling between 5258-5278. Although higher levels intraday selling patterns but lower levels supports also therefore sustaining beyond mentioned today trading range should be firstly watched for next decisive moves confirmations.
Post-open Outlook(23-03-2012)
Sharp down yesterday after higher levels good selling yesterday but positive market since opening today. Nifty recovered immediately after opening but failed to cross resistance at 5295 and slipped after intraday selling patterns between 5258-5278.
Nifty got support 2 times earlier near 5200 and again trading above 5200 today after forming low at 5205.6 and sustaining beyond 5210 should be firstly watched for nexts decisive moves cinfirmations.
Nifty got support 2 times earlier near 5200 and again trading above 5200 today after forming low at 5205.6 and sustaining beyond 5210 should be firstly watched for nexts decisive moves cinfirmations.
Long Term Trend Again at Stake
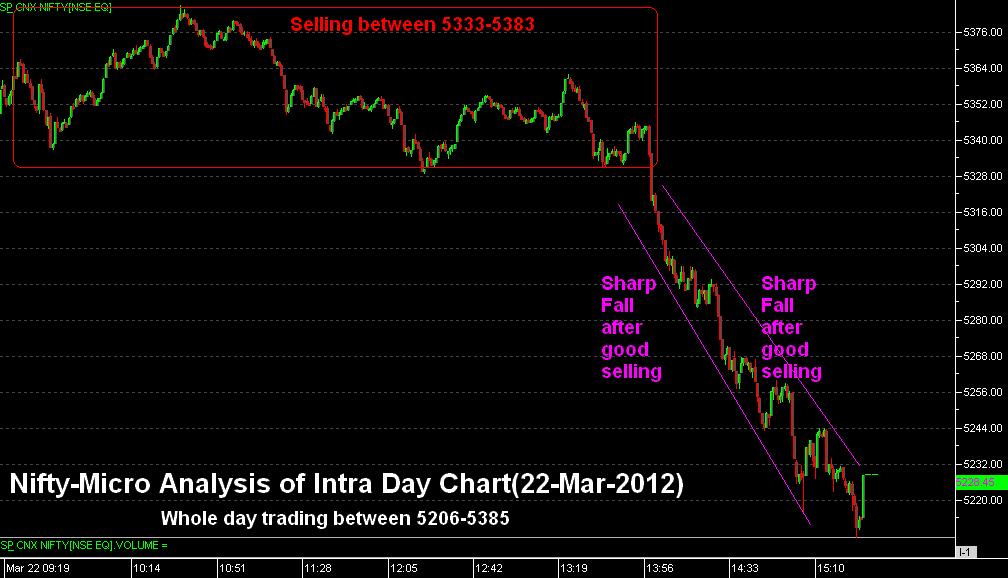
Nifty-Intra Day Chart(22-Mar-2012):-
Technical Patterns and Formations in today intraday charts
1- Selling between 5333-5383
2- Sharp Fall after good selling.
3- Whole day trading between 5206-5385
As soon as selling formation got confirmation then it was updated in Mid-session Outlook and only selling was repeated in all the intraday Outlooks as well as next targets were projected which achieved also.
Intermediate and Short Term Trends are down.Long Term trend is up but certainly at stake after good selling at higher levels and sustaining below following 2 levels will be confirmation Long Term Trend torning down:-
1- 200-Day EMA- 5203
2- 200-Day SMA- 5157
Sustaining below 5157 should be firstly watched tomorrow for Long Term Trend survival confirmations.
 |
| Just click on chart for its enlarged view |
1- Selling between 5333-5383
2- Sharp Fall after good selling.
3- Whole day trading between 5206-5385
Conclusions from intra day chart analysis
As soon as selling formation got confirmation then it was updated in Mid-session Outlook and only selling was repeated in all the intraday Outlooks as well as next targets were projected which achieved also.
Intermediate and Short Term Trends are down.Long Term trend is up but certainly at stake after good selling at higher levels and sustaining below following 2 levels will be confirmation Long Term Trend torning down:-
1- 200-Day EMA- 5203
2- 200-Day SMA- 5157
Sustaining below 5157 should be firstly watched tomorrow for Long Term Trend survival confirmations.

Indian Stock Markets Closing Reports(22-Mar-2012)
Main features of today trading are as follows
1- All the Indices closed in Red.
2- Long Black Candle.
3- Closing near the lows of the day.
Ratios
Nifty Put Call Ratio: 1.18
Nifty P/E Ratio(22-Mar-2012): 18.47
Advances & Declines
BSE Advances : 837
BSE Declines : 2071
NSE Advances : 287
NSE Declines : 1179
Nifty Open Interest Changed Today
Nifty- 5100 CE(Mar)- +495350(+66.62%)
Nifty- 5100 PE(Mar)- -1555650(-21.14%)
Nifty- 5200 CE(Mar)- +1505250(+63.88%)
Nifty- 5200 PE(Mar)- -146100(-1.85%)
Nifty- 5300 CE(Mar)- +805900(+21.22%)
Nifty- 5300 PE(Mar)- -849500(-13.60%)
Nifty- 5400 CE(Mar)- +1421500(+25.72%)
Nifty- 5400 PE(Mar)- -1052550(-22.40%)
Closing
Nifty- closed at 5,228.45(-136.50 Points & -2.54%)
Sensex- closed at 17,196.47(-405.24 Points & -2.30%)
CNX Midcap - closed at 7,610.90(-183.85 Points & -2.36%)
BSE Smallcap- closed at 6,599.69(-112.51 Points & -1.68%)
FII & DII trading activity in Capital Market Segment on 22-Mar-2012
| ||||||||||||||||
| ||||||||||||||||
Nifty Spot-Levels & Trading Strategy for 23-03-2012
Nifty Spot-Levels
R3 5520
R2 5452
R1 5340
Avg 5272
S1 5160
S2 5092
S3 4980
Nifty Spot-Trading Strategy
H6 5408 Trgt 2
H5 5367 Trgt 1
H4 5327 Long breakout
H3 5277 Go Short
H2 5261
H1 5244
L1 5211
L2 5195
L3 5178 Long
L4 5129 Short Breakout
L5 5088 Trgt 1
L6 5047 Trgt 2
R3 5520
R2 5452
R1 5340
Avg 5272
S1 5160
S2 5092
S3 4980
Nifty Spot-Trading Strategy
H6 5408 Trgt 2
H5 5367 Trgt 1
H4 5327 Long breakout
H3 5277 Go Short
H2 5261
H1 5244
L1 5211
L2 5195
L3 5178 Long
L4 5129 Short Breakout
L5 5088 Trgt 1
L6 5047 Trgt 2
Subscribe to:
Comments (Atom)