ॐ ह्रीं श्रीं लक्ष्मीभयो नमः॥


Trading "calls" from our "Software" with more than "90% accuracy"

 This is the "Oldest & Only Website" of whole World
which is updating Nifty & Indian Stock Markets
"Daily and Weekly accurate Outlooks" 
with "Intraday Charts Analysis"for the 
last more than "14 years" means from "2010"
For its live Proofs just see "Archive"
in the "bottom of this Website".

Market Outlook(01-06-2011)


Technical Analysis and Research of EOD chart,Micro Analysis of Nifty Intra Day Chart,Technical Positions and next possibilities have already been explained in following topics with 2 Charts therefore not being repeated:-


1- Technical Analysis and Research For 01-06-2011
2- Nifty-Micro Analysis of Intra Day Chart For 01-06-2011
3- Why range of 5500-5605 is Next Trend Deciding?

Conclusions (After Putting All Studies Together)

Short term and Intermediate term trends turned up yesterday and Long term trend will be up after sustaining above 5605. Almost 70% of the resistance has been cleared yesterday and remaining 30% resistance is not strong. Sustaing above 5605 will mean begining of fresh upmoves and worst is over.

Whole day continuous up moves were seen yesterday and in the last short term indicators turned overbought,sentiment was heated and intraday selling patterns seen in the last one hour between 5555-5570 therefore intraday consolidation is demand for today market. Good consolidations at lower levels therefore market require complete distribution patterns for any decisive down moves and whenever such intraday patterns will develop then first of all will be posted in this Blog only.

Finally Nifty moved above Wave-5 trend line(Rising lower line of Pennant) yesterday and with this Wave-5 and Pennant existence have been validated again therefore Indian markets are mature for big rally also and only last point is sustaining above 5605 and long term trend turning up.

As Nifty has to decisively cross 5605 therefore Nifty may take few hours to few session in consolidation process between 5540-5605 but very much expected that Nifty will finally cross and sustain above 5605 in the coming sessions/week and strong rally will be seen.

Technical Analysis and Research For 01-06-2011

Nifty-EOD Chart(31-05-2011):-
Just click on chart for its enlarged view
Corrective 'ABC' wave-4 started on 05-10-2010 from 6338 which completed on 11-02-2010 at 5177 and impulsive wave-5 begun same day. It is clear from EOD chart that trend continuation Pennant formation since begining of wave-5 but Rising trend line of Pennant was broken down on 17-05-2011.

As post 17th May down move was without force and intraday charts were showing consolidations therefore Pull Back Rally expectations was told many times in previous week and it was seen also.Following lines were also told in Weekly Outlook on 30-05-2011

trend has reversed in previous week and Nifty will consolidate,test and cross next strong resistance range(5500-5605) in the coming weeks and Nifty will finally cross 5605.

Finally Nifty moved above Wave-5 trend line(Rising lower line of Pennant) today and with this Wave-5 and Pennant existence have also came into being. Nifty today highest was at 5571.60 and only question is left to be answered that Nifty is sustaining above 5605 or not.

Expected that Nifty will finally cross and sustain above 5605 in the coming sessions/week.

FII Trading Data in Derivatives Segment on 31-May-2011


FII & DII trading activity in Capital Market Segment on 31-May-2011

FII trading activity on NSE and BSE in Capital Junket Segment(In Rs. Crores)
CategoryDateBuy ValueSell ValueNet Value
FII01-Jun-20116271.324960.341310.98


DII trading activity on NSE and BSE in Capital Junket Segment(In Rs. Crores)
CategoryDateBuy ValueSell ValueNet Value
DII01-Jun-20111170.341767-596.66

Nifty-Micro Analysis of Intra Day Chart For 01-06-2011

Nifty-Intra Day Chart(31-05-2011)
Just click on chart for its enlarged view
Main Features

1-Intraday rally.
2- Whole day consolidations except last one hour selling patterns.

Conclusions

As Nifty traded between resistance range therefore continuously consolidated and moved up. Sentiment was heated therefore some selling patterns seen in last 1 hour(5555-5570). Nifty require more consolidation to cross complete resistance range(5500-5605). As good consolidation today therefore expected that Indian markets will firstly consolidate within mentioned resistance range and then Nifty will move above 5600 within 2/3 sessions.

Indian Stock Markets Closing Reports(31-05-2011)


Main features of today trading are as follows

1- Long White Bullish Candle.
2- All the Indices closed in Green with good gains.
3- Good lower level consolidations.

Ratios

Nifty Put Call Ratio: 1.05
Nifty P/E Ratio(30-05-2011): 20.25

Advances & Declines

BSE ADVANCES : 1830
BSE DECLINES : 1022
NSE ADVANCES : 1009
NSE DECLINES :  399

Nifty Open Interest Changed Today

Nifty- 5400 CE(Jun)- -11650(-0.43%)
Nifty- 5400 PE(Jun)- +1081400(+20.78%)

Nifty- 5500 CE(Jun)- -355200(-8.84%)
Nifty- 5500 PE(Jun)- +1359800(+42.37%)

Nifty- 5600 CE(Jun)- +810500(+18.92%)
Nifty- 5600 PE(Jun)- +760250(+55.01%)

Nifty- 5700 CE(Jun)- +697900(+16.46%)
Nifty- 5700 PE(Jun)- +113350(+19.25%)

Closing 

Nifty- closed at 5,560.15(+87.05 Points & +1.59%)
Sensex- closed at 18,503.28(+271.22 Points & +1.49%)
CNX MIDCAP - closed at 8,064.80(+118.90 Points & +1.50%)
BSE SMALL CAP- closed at 8,235.72(+81.08 Points & +0.99)

Nifty Spot-Levels & Trading Strategy for 01-06-2011

Nifty Spot-Levels

R3 5673.00
R2 5622.00
R1 5591.00
Avg 5540.00
S1 5509.00
S2 5458.00
S3 5427.00

Nifty Spot-Trading Strategy

H6  5643    Trgt 2
H5  5624    Trgt 1
H4  5605    Long breakout
H3  5582    Go Short
H2  5575
H1  5567
L1  5552
L2  5544
L3  5537    Long
L4  5514    Short Breakout
L5  5495    Trgt 1
L6  5476    Trgt 2

Nifty(Jun Fut)-Levels & Trading Strategy for 01-06-2011

Nifty(Jun Fut)-Levels

R3 5667.67
R2 5615.33
R1 5584.67
Avg 5532.33
S1 5501.67
S2 5449.33
S3 5418.67

Nifty(Jun Fut)-Trading Strategy

H6 5638     Trgt 2
H5 5618     Trgt 1
H4 5599     Long breakout
H3 5576     Go Short
H2 5569
H1 5561
L1 5546
L2 5538
L3 5531     Long
L4 5508     Short Breakout
L5 5489     Trgt 1
L6 5469     Trgt 2

Bank Nifty(Jun Fut)-Levels & Trading Strategy for 01-06-2011

Bank Nifty(Jun Fut)-Levels

R3 11220.00
R2 11082.00
R1 11006.00
Avg 10868.00
S1 10792.00
S2 10654.00
S3 10578.00

Bank Nifty(Jun Fut)-Trading Strategy

H6 11147     Trgt 2
H5 11097     Trgt 1
H4 11047     Long breakout
H3 10988     Go Short
H2 10969
H1 10949
L1 10910
L2 10890
L3 10871     Long
L4 10812     Short Breakout
L5 10762     Trgt 1
L6 10712     Trgt 2

Pre-closing Outlook(31-05-2011)

All are Bullish today but today Bullish market was told minimum 3 times in this Blog yesterday and following lines were also told:-

Expected that Nifty will finally sustain above 5473 tomorrow and will open the gate of next resistance(5500-5605) and Indian markets will close positive tomorrow.

Today low is at 5489.70. Bulls broken the gate and conquered 71% land of  bears(5500-5605) today and expected that will first take rest and gain strength between 5540-5600 tomorrow.

As sentiment turned heated in last 1 hour therefore matket will first consolidate between 5540-5600 tomorrow and after that rally above 5605 will be seen within couple of sessions.

Importance of Intraday Charts analysis

Intraday charts analysis is key of stocks and  commodities markets analysis and following types of predictions are possible only after complete command on intraday charts analysis.

No confusion,no guessing,not both sides many levels,no futile talks and only clear accurate predictions on the basis of intraday charts analysis in following lines yesterday;-

Expected that Nifty will finally sustain above 5473 tomorrow and will open the gate of next resistance(5500-5605) and Indian markets will close positive tomorrow.

Enjoy Daily Profits Prediction on 30-05-2011 for today

Following line was told yesterday in Technical Analysis,Research & Market Outlook for 31-05-2011

Expected that Nifty will finally sustain above 5473 tomorrow and will open the gate of next resistance(5500-5605) and Indian markets will close positive tomorrow.

Mid-session Outlook-2(31-05-2011)

Panic down after profit booking and GDP down news but support above 5500 therefore yesterday started fresh upmove is intact.

Mid-session Outlook(31-05-2011)

Profit booking seen between 5520-5532 and market down after GDP announcement. As profit booking seen between resistance range(5500-5605) therefore sustaining above 5509 is must for next upmove confirmations.


              All moves of Indian Stock Markets 
                  are predicted only in this Blog


            Bullish Market and Today Rally 

             was non stop,again and again 

         Predicted only in this Blog
       
          Only We Told Rally In 
          Indian Stock Markets

Post-open Outlook(31-05-2011)


Indian markets closed flat and slipped from higher levels yesterday but intraday charts showed consolidations therefore today upmove was proved and following lines were told yesterday

intraday patterns of today are suggesting whole day consolidations therefore upmoves with continuous consolidations possibility is high

Just verify above lines from following topic:-

Nifty-Micro Analysis of Intra Day Chart For 31-05-2011

Following line was also told in Pre-closing Outlook yesterday

Intraday charts of today are suggesting consolidations. Upmoves are expected in the coming sessions

Market require consolidation before every rise between 5500-5605 therefore expected that slow and steady up moves will be seen. As Indian markets have entered into strong resistance range therefore consolidations require after every rise and sustaining above 5509 will be next upmove confirmation and trigger for next upmoves .

Intraday patterns of first 45 minutes are showing consolidations therefore expected that Nifty will sustain above 5509 and upmoves will be seen.

Pre-open Outlook(31-05-2011)

Dow futures is trading 70 points up today morning therefore sentiment is good and all the Asian markets are trading positive today morning,expected that Nifty will open positive and firstly hover around 5500. It has already been proved in following topic that 5500-5605 is strong resistance range and Indian markets require complete consolidations to cross it.

Why range of 5500-5605 is Next Trend Deciding?

Expected that Nifty will first trade between yesterday range(5458-5509) and break out of this range will give confirmation to next moves. Sustaining above 5509 today will give confirmation to yesterday consolidation and up moves expectations will turn higher after continuous consolidation between 5500-5605.

Technical Analysis,Research & Market Outlook for 31-05-2011

Technical Analysis,Research(EOD & Weekly) for current week and Micro Analysis of Intra Day Chart(30-05-2011) have already been explained in following topics:-

1- Nifty-Micro Analysis of Intra Day Chart For 31-05-2011
2- Weekly Outlook(May 30 to Jun 03,2011)

Conclusions (After Putting All Studies Together)

Nifty Black Candle today but it does not mean weak market and selling. Broader market was not weak but Mid Cap and Small Cap Indices closed positive with more than half pct gains. Above all conslusions from Micro Analysis of today intra Day Chart is showing consolidation patterns. Support and base formation seen between 5459-5473 today and Nifty sustaining above 5473 tomorrow will mean Bull gaining strength between 5459-5473 today for conquering next strong resistance(5500-5605)

Expected that Nifty will finally sustain above 5473 tomorrow and will open the gate of next resistance(5500-5605) and Indian markets will close positive tomorrow.

Only sustaining beyond 5459-5473 will be watched for next moves confirmations.


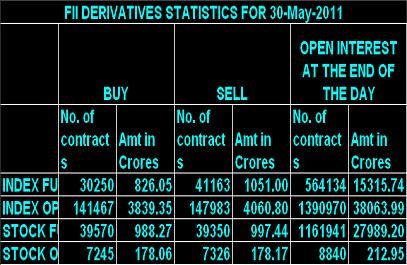
FII Trading Data in Derivatives Segment on 30-May-2011


FII & DII trading activity in Capital Market Segment on 30-May-2011

FII trading activity on NSE and BSE in Capital Junket Segment(In Rs. Crores)
CategoryDateBuy ValueSell ValueNet Value
FII01-Jun-20112431.252177.77253.48


DII trading activity on NSE and BSE in Capital Junket Segment(In Rs. Crores)
CategoryDateBuy ValueSell ValueNet Value
DII01-Jun-2011740.25790.64-50.39