ॐ ह्रीं श्रीं लक्ष्मीभयो नमः॥


 This is the "Oldest & Only Website" of whole World
which is updating Nifty & Indian Stock Markets
"Daily and Weekly accurate Outlooks" 
with "Intraday Charts Analysis"for the 
last more than "14 years" means from "2010"
For its live Proofs just see "Archive"
in the "bottom of this Website".

Trading "calls" from our "Software" with more than "90% accuracy"

Bullish Rally Strong Indication From Pennant Formation

Wave-4 Correction in Continuation Pattern Pennant Formation

Waves chart showing Uptrend in EOD Chart:-
Just click on chart for its enlarged view
Pennant pattern formation in Wave-4 Correction;-
Just click on chart for its enlarged view
Corrective Wave-4 begun on Diwali-2010 from 5338 and terminated at 5177 on 11-02-2011,impulsive Wave-5 begun from same point as well.

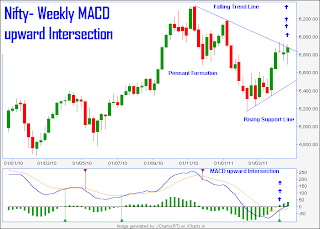
Market is in up trend and and EOD chart is showing Pennant pattern formation in its corrective move which is continuation pattern. It means continuation of on going trend because it is not a trend reversal pattern but trend continuation pattern. As on going trend is Bullish therefore its continuation expected after Pennant falling trend line upward intersection in the coming weeks.

Bullish Formation:Nifty- Weekly MACD upward Intersection


Just click on chart for its enlarged view
MACD

Most important development 3 week before that MACD line upward intersection of Average line and it is confirmation of rally. Weekly MACD cross over gives confirmation to long trend therefore strong confirmation to up trend 3 weeks before. Both lines started to move up near equilibrium line and MACD line has moved it above therefore it is strong indication of rally in the coming week.
Weekly Outlook(25-04 to 29-04-2011) and many other topics will be posted daily in next 3 days for guidance in next week trading and expected next Bull Rally also.

Post-closing Report(21-04-2011) & Monday Outlook

Following line was told in Post-open Outlook at 09:36:00 AM today:-

"Gap up opening but not strong"

As clearly told not strong within first half hour and today intra day results are as follows:-

1- Market did not moved up,closed at opening level and today Candle is 'Doji'(confusion)
2- MIDCAP and SMALL CAP slipped and closed near lower levels but not completely selling patterns.
3- Higher levels selling and it was also told with intraday chart at 12:49:00 PM today.
4- Confirm mixed patterns selling at higher levels and buying at lower levels.

Ratios:

Nifty Put Call Ratio: 1.14
Nifty P/E Ratio(21-04-2011):22.18

Advances & Declines:

BSE ADVANCES : 1405
BSE DECLINES : 1523
NSE ADVANCES :  634
NSE DECLINES :  775

Nifty Open Interest Changed Today:-

Nifty- 5700 CE(28APR2011)- -287450(-8.51%)
Nifty- 5700 PE(28APR2011)- +370300(+4.46%)

Nifty- 5800 CE(28APR2011)- -713200(-15.29%)
Nifty- 5800 PE(28APR2011)- +675850(+9.68%)

Nifty- 5900 CE(28APR2011)- -141000(-2.31%)
Nifty- 5900 PE(28APR2011)- +2506200(+50.50%)

Closing :-

Nifty- closed at 5,884.70(+33.05 Points & +0.56%)
Sensex- closed at 19,602.23(+131.25 Points & +0.67% )
CNX MIDCAP - closed at 8,313.95(+9.05 Points & +0.11%)
BSE SMALL CAP- closed at 8,878.57(+2.77 Points & +0.03%)

Nifty-Micro Analysis of Intra Day Chart(21-04-2011):-
Just click on chart for its enlarged view
Monday(25-04-2011) Outlook

Market was not strong since opening today and it was told within first half hour and today intra day selling was also shown through intra day chart. Although Nifty and SENSEX closed positive with moderate gains but today intraday intra day charts are suggesting mixed formations.

Today intra day consolidation was technical requirements because:-

1- Yesterday last one hour Rising Wedge(Bearish Pattern) Formation between 5825-5855
2- Next immediate resistance range(5860-5940)

Following lines were told in Pre-open Outlook today  and again repeating today because already mentioned market moves will be seen in the coming sessions also:-

"Nifty will trade within immediate resistance range(5860-5940) therefore fresh consolidation and follow up buying is must to cross mentioned resistance."

Mixed patterns today and Market require more preparation for any side sustained moves and that will be done near today range on Monday. All trends are up and today consolidation signals also ssen today despite higher levels selling therefore consolidation and follow up buying possibility can not be ruled out on Monday .

Possibilities have been discussed above but Indian market require more preparation for any side sustained moves and that will be done near about today range(5864-5912) on Monday. As intra day higher levels selling today therefore First 3/4 hours intraday patterns will certainly be watched first on Monday and follow up buying snd consolidation will be next rally confirmation.

FII Trading Data in Derivatives Segment on 21-Apr-2011


Nifty-Micro Analysis of Intra Day Chart(21-04-2011)


Just click on chart for its enlarged view

Following lines were told whole day for today market:-

1-Market will prepare for next week market today
2-market require some more consolidation to cross following 2 resistances

Following line was told for today market in Nifty-Micro Analysis of Intra Day Chart(at 12:34 PM on 20-04-2011):-

Lower levels buying and higher levels selling today. Mixed patterns at this moment and let market prepare for one side move then confirmation will be possible.

Following today market conclusive lines are being told since morning in all the outlooks and not being told after watching today closing:-

Selling between 5908-5912
Selling between 5880-5896

Buying between 5870-5880
Buying between 5868-5876

Mixed patterns today therefore Indian market require more preperation for any side sustained moves and that will be done near today range(5864-5912) on Monday.

FII & DII trading activity in Capital Market Segment on 21-Apr-2011

FII trading activity on NSE and BSE in Capital Aprket Segment(In Rs. Crores)
CategoryDateBuy ValueSell ValueNet Value
FII21-Apr-20112799.782491.99307.79


DII trading activity on NSE and BSE in Capital Aprket Segment(In Rs. Crores)
CategoryDateBuy ValueSell ValueNet Value
DII21-Apr-20111076.571346.19-269.61

Nifty Spot-Levels & Trading Strategy for 25-04-2011

Nifty Spot-Levels

R3 5957
R2 5934
R1 5909
Avg 5886
S1 5861
S2 5838
S3 5813

Nifty Spot-Trading Strategy

H6 5932     Trgt 2
H5 5921     Trgt 1
H4 5910     Long breakout
H3 5897     Go Short
H2 5892
H1 5888
L1 5879
L2 5875
L3 5870     Long
L4 5857     Short Breakout
L5 5846     Trgt 1
L6 5835     Trgt 2

Nifty(Apr Fut)-Levels & Trading Strategy for 25-04-2011

Nifty(Apr Fut)-Levels

R3 5980
R2 5955
R1 5929
Avg 5904
S1 5878
S2 5853
S3 5827

Nifty(Apr Fut)-Trading Strategy

H6 5954     Trgt 2
H5 5942     Trgt 1
H4 5931     Long breakout
H3 5917     Go Short
H2 5912
H1 5907
L1 5898
L2 5893
L3 5888     Long
L4 5874     Short Breakout
L5 5863     Trgt 1
L6 5851     Trgt 2

Bank Nifty(Apr Fut)-Levels & Trading Strategy for 25-04-2011

Bank Nifty(Apr Fut)-Levels

R3 12066
R2 12013
R1 11969
Avg 11916
S1 11872
S2 11819
S3 11775

Bank Nifty(Apr Fut)-Trading Strategy

H6 12023     Trgt 2
H5 12001     Trgt 1
H4 11979     Long breakout
H3 11952     Go Short
H2 11943
H1 11934
L1 11917
L2 11908
L3 11899     Long
L4 11872     Short Breakout
L5 11850     Trgt 1
L6 11828     Trgt 2

Nifty Spot-Weekly Levels & Trading Strategy(25 Apr to 29-04-2011)

Nifty Spot-Weekly Levels

R3 6185
R2 6048
R1 5966
Avg 5829
S1 5747
S2 5610
S3 5528

Nifty Spot-Weekly Trading Strategy 

H6 6110     Trgt 2
H5 6057     Trgt 1
H4 6004     Long breakout
H3 5944     Go Short
H2 5924
H1 5904
L1 5863
L2 5843
L3 5823     Long
L4 5763     Short Breakout
L5 5710     Trgt 1
L6 5657     Trgt 2

Pre-closing Report(21-04-2011)

Following lines were told for today market

Market will prepare for next week market today
market require some more consolidation to cross following 2 resistances

Market traded whole day on expected lines and prepared within remained range bound moves between 5868-5910. As Patterns are mixed and selling also seen at higher levels therefore today trading range break out will give big move confirmation.

Market require more preperation for any side sustained moves and that will be done near today range on Monday.

Nifty-Micro Analysis of Intra Day Chart(at 12:34 PM on 21-04-2011)

1
Just click on chart for its enlarged view

Lower levels buying abd higher levels selling today. Mixed patterns at this moment and let market prepare for one side move then confirmation will be possible.

Mid-session Outlook-2(21-04-2011)

Next immediate resistance range is- 5860-5940
Nifty First trading range is- 5872-5890

Nifty crossed 5890 and formed high at 5912.90 today and it is strong indication of today consolidation and follow up buying. Market require complete consolidation within 5860-5940 now to cross 5940 and sustain above.

First 2 hours of today market has indicated consolition and Nifty sustaining above 5890 will be its confirmation.

Market is prepring for next moves within resistance range,let this process complete and then next immediate moves will be decided according to confirmation from sustaining beyond mentioned crucial  levels.

Mid-session Outlook(21-04-2011)

Following lines were told for today market

Market will prepare for next week market today
market require some more consolidation to cross following 2 resistances

Nifty firstly traded between 5872-5890,prepared and crossed 5890. It is strong indication of today consolidation and follow up buying.

Post-open Outlook(21-04-2011)


Gap up opening but not strong. Let market prepare for next moves then will be decided acording to intra day patterns formations.

Pre-Open Market Outlook(21-04-2011)

Today Outlook and Technical Positions have already been posted in following topic with 1 Chart yesterday therefore not repeated today:-

Post-closing Report(20-04-2011) & Tomorrow Outlook

Asian markets are equally as strong as US and European markets delivered cues yesrerday and Indian markers will open gap up. Yesterday last one hour Rising Wedge(Bearish Pattern) Formation between 5825-5855 and Nifty will trade within immediate resistance range(5860-5940) therefore fresh consolidation and follow up buying is must to cross mentioned resistance.

Sentiment heated today morning therefore profit booking possibility will also be kept in mind. Indian markets are technically poised for rally above 5940 but market require fresh consolidation and follow up buying within mentioned resistance range. Today trading session is crucial and will react on TCS results during trading hours and will also prepare for next Monday post RIL results market. Following points will be kept in mind today:-

1- TCS results during trading hours today.
2- RIL results after trading hours today.
3- Yesterday last one hour Rising Wedge(Bearish Pattern) Formation between 5825-5855
4- Today trading between resistance range(5860-5940)
5- Sentiment heated today therefore profit booking possibility
6- Next 3 Days holidays.

Market will prepare for next week market today and may be volatile also therefore  first 3/4 hours intraday patterns will be watched and then final conclusion will be drawn and will be posted accordingly. Rally above 5940 is very much possible in next week but today market will also be watched for next immediate move confirmations.

Rally has been Triggered

Post-closing Report(20-04-2011) & Tomorrow Outlook


Main features of today market are as follows


1- Long White Bullish Candle
2- All the indices closed with good gains near day's highest levels.
3- Confirmation of impulsive Sub Wave-G begining.
4- Good consolidation between 5760-5805
5- Rising Wedge(Bearish pattern) between 5825-5855.

Ratios:

Nifty Put Call Ratio: 0.89
Nifty P/E Ratio(19-04-2011):21.65

Advances & Declines:

BSE ADVANCES : 1957
BSE DECLINES :  961
NSE ADVANCES : 1040
NSE DECLINES :  366

Nifty Open Interest Changed Today:-

Nifty- 5800 CE(28APR2011)- -2397300(-33.34%)
Nifty- 5800 PE(28APR2011)- +2133750(+43.39%)

Nifty- 5900 CE(28APR2011)- -568800(-7.79%)
Nifty- 5900 PE(28APR2011)- +2414500(+93.04%)

Closing :-

Nifty- closed at 5,851.65(+110.90 Points & +1.93%)
Sensex- closed at 19,470.98(+349.15 Points & +1.83% )
CNX MIDCAP - closed at 8,304.90(+100.15 Points & +1.22%)
BSE SMALL CAP- closed at 8,875.80(+113.15 Points & +1.29%)

Nifty-Micro Analysis of Intra Day Chart(20-04-2011):-
Just click on chart for its enlarged view
Tomorrow(21-04-2011) Outlook

Following 3 Bullish confirmations today:-

1- 'ABC' correction completion.
2- Sub Wave-F support at 38.2% retracement level.
3- Impulsive Sub Wave-G begining has confirmed.

Rally was confirmed yesterday on the basis of intra day base formations and lower levels support and since then only views were posted in all the outlooks. Intra day patterns of today  have already been discussed in Nifty-Micro Analysis of Intra Day Chart and market require some more consolidation to cross following 2 resistances:-

1- 5860-5900
2- 5910-5940

As bullish rally is on therefore higher level consolidation is very much possible in the coming sessions and after that sharp rally will be seen after sustaining above 5640 and once sustaining above 5940 will mean 6120 fast.

Only watch sustaining above 5940 for sharp rally confirmation. As Sub Wave-F has completed correction at 38.2% retracement level yesterday therefore consolidation near about above mentioned resistances and rally above 5940 expected in the coming sessions.

Rally has been Triggered and sustaining above 5940 is last formality. 

FII Trading Data in Derivatives Segment on 20-Apr-2011


Nifty-Micro Analysis of Intra Day Chart(20-04-2011)


Just click on chart for its enlarged view

Consolidation between 5760-5805 after gap up opening. As sentiment was heated therefore intraday panic bottom was seen in consolidation process. Last one hour Rising Wedge(Bearish Pattern) Formation between 5825-5855 therefore initial hours watching is required but Bullish rally is on and in Bullish rally higher levels consolidation possibility remains high. Until follow up selling will not develop till then any down move will not be seen.

FII & DII trading activity in Capital Market Segment on 20-Apr-2011

FII trading activity on NSE and BSE in Capital Aprket Segment(In Rs. Crores)
CategoryDateBuy ValueSell ValueNet Value
FII20-Apr-20112473.172280.17193


DII trading activity on NSE and BSE in Capital Aprket Segment(In Rs. Crores)
CategoryDateBuy ValueSell ValueNet Value
DII20-Apr-2011993.171016.45-23.27