ॐ ह्रीं श्रीं लक्ष्मीभयो नमः॥


Trading "calls" from our "Software" with more than "90% accuracy"

 This is the "Oldest & Only Website" of whole World
which is updating Nifty & Indian Stock Markets
"Daily and Weekly accurate Outlooks" 
with "Intraday Charts Analysis"for the 
last more than "14 years" means from "2010"
For its live Proofs just see "Archive"
in the "bottom of this Website".
Firstly watch levels amid Delhi Assembly Election results and Corona virus fear
Intra Day Chart Analysis & Market Outlook
(11-02-2020)
Nifty-Intra Day Chart (10-Feb-2020):-
Just click on chart for its enlarged view
Technical Patterns formation in today intraday charts

1- Sharp fall after flat opening
2- Support between 11991-12022
3- Up moves in Bearish Rising Channels
4- Whole day actual trading between 11991-12103

Conclusions from intra day chart analysis 

Following lines were told on 08-02-2020 in "Firstly watch level in next week for the life and length of expected correction":-

1- down moves below last Friday lowest(12073.95) is expected in the beginning of next week.
2- Next supports below last Friday lowest are as follows:-

1- 11983-12021
2- 11922-11951
3- 11615-11705

As was told 100% same happened in following manner:-

1- Nifty slipped below 12073.95 in first 2 minutes today and also traded whole day below it. 
2- Today lowest was within mentioned 1st supports range(11983-12021) at 11990.75.

As Nifty again got supports within 1st supports range(11983-12021) between 11991-12022 and also closed just above it at 12031.50 today therefore this range has become most crucial and until Nifty will not sustain below it till then decisive down moves will not be seen. 

Although lower levels good supports today but minor selling was also seen through Up moves in Bearish Rising Channels therefore firstly sustaining beyond 11983-12045 should be watched tomorrow for next decisive moves confirmations because Indian markets will react Delhi Assembly Election results through high volatility and Corona virus fear led Global markets reactions.
Firstly watch level in next week for the life and length of expected correction
Technical Analysis,Research & Weekly Outlook
(Feb 10 to Feb 14,2020)
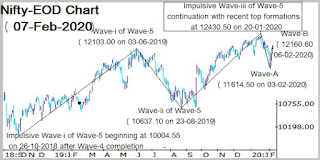
Nifty-EOD Chart Analysis
(5th Wave structure)
Nifty-EOD Chart (07-Feb-2020):-
Just click on chart for its enlarged view
Technical Patterns and Formations in EOD charts

1- Impulsive Wave-i of Wave-5 beginning at 10004.55 on 26-10-2018 after Wave-4 completion
2- Wave-i of Wave-5 completion at 12103.00 on 03-06-2019 and corrective Wave-ii beginning
3- Corrective Wave-ii of Wave-5 completion at 10637.10 on 23-08-2019 and impulsive Wave-iii beginning
4- Impulsive Wave-iii of Wave-5 continuation with recent top formations at 12430.50 on 20-01-2020
5- Wave-A completion at 11614.50 on 03-02-2020
6- Wave-B completion at 12160.60 on 06-02-2020

Nifty-Intra Day Chart Analysis 
(07-Feb-2020)
Nifty-Intra Day Chart (07-Feb-2020):-
Just click on chart for its enlarged view
Technical Patterns formation in today intraday charts

1- Selling between 12104-12136
2- Selling between 12098-12108
3- Selling between 12096-12113
4- Whole day actual trading between 12074-12154

Conclusions from EOD chart analysis 

1- Long Term Trend is up after moving above its decider 200 Day SMA(today at 11663.40)
2- Intermediate Term Trend sideways.
3- Short Term Trend has turned up after last week rally.

Conclusions from intra day chart analysis 

As higher levels good selling therefore down moves below last Friday lowest(12073.95) is expected in the beginning of next week.

Conclusions (After Putting All Studies Together)

Following lines were told on 01-02-2020 in "Strong rally after Global markets recovery from Corona virus fear":-

27.0% retracement has been completed and Short Term Indicators have also turned Oversold therefore some up moves towards following resistances can not be ruled out and until Nifty will sustain above 12216 till then correction completion will not be considered.

1- 11808-111842
2- 11900-12017
3- 12003-12048
4- 12125-12169
5- 12160-12216

Strong rally was seen in previous week which completed near the top of above mentioned 4th resistance at 12160.60 on 06-02-2020. 

Next and last 2 resistances above 12216 are as follows:-

1- 12220-12262
2- 12317-12378

Although strong rally in first 3 sessions of previous week but some selling was also seen at higher levels in last 2 sessions between 12096-12160 as well as Short Term Indicators have turned over bought therefore down moves are firstly expected in th ebeginning of next week.

As above mentioned multiple resistances are also lying above last week highest therefore until complete consolidation will not develop till then fresh rally above life time highest will not be seen and follow up selling in the beginning of next week will mean correction continuation towards the bottom of Wave-A(11614.50).

Next supports below last Friday lowest are as follows:-

1- 11983-12021
2- 11922-11951
3- 11615-11705

Follow up selling and correction continuation below 11922 will mean Wave-C formation for moving below the bottom of Wave-A(11614.50) therefore sustaining beyond 11922 should be firstly watched in next week for the life and length of expected correction. 
Fresh selling will mean sharp down moves
Intra Day Chart Analysis & Market Outlook
(07-02-2020)
Nifty-Intra Day Chart (06-Feb-2020):-
Just click on chart for its enlarged view
Technical Patterns formation in today intraday charts

1- Down moves in Bullish Falling Channel
2- Mixed Patterns formation in last 4 hours between 12102-12160 
3- Whole day actual trading between 12085-12160

Conclusions from intra day chart analysis 

Following resistances were updated yesterday in "Firstly fresh consolidation and only after that rally continuation towards following next resistances":-

1- 12125-12169
2- 12160-12216 

Firstly consolidation was seen through Down moves in Bullish Falling Channel and after that up moves wre seen but last 4 hours trading was with Mixed Patterns formation and RBI Credit policy led volatility was also seen which means that one sided technical positions have not developed today. 

As today closing was within yesterday mentioned first resistance range(12125-12169) at 12137.95 and above it more resistances are lying up to 12216 therefore more consolidation is required for fresh up moves above 12216. 

Expected that Nifty will firstly trade within 12085-12216 in the coming sessions and finally sustaining beyond this range will form next trend. As Short Term Indicators have turned over bought and minor selling was also seen at higher levels today as well as resistances are lying above today highest therefore if fresh selling develop tomorrow then sharp down moves may be seen below today lowest(12085),be cautious.
Firstly fresh consolidation and only after that rally continuation towards following next resistances
Intra Day Chart Analysis & Market Outlook
(06-02-2020)
Nifty-Intra Day Chart (05-Feb-2020):-
Just click on chart for its enlarged view
Technical Patterns formation in today intraday charts

1- More than 4 hours Mixed Patterns formation between 11980-12050
2- Slow up moves in last 2 hours
3- Whole day actual trading between 11954-12098

Conclusions from intra day chart analysis 

Although today closing was at the higher levels of the day but before that genuine consolidation patterns were not seen because firstly more than 4 hours trading was with Mixed Patterns formations and after that last 2 hours up moves were slow which is an indication of some selling also therefore firstly fresh consolidation near about today highest and after that sustaining above it should be watched tomorrow for rally continuation towards following next resistances:-

1- 12125-12169
2- 12160-12216 
As busy therefore Stock Market Outlook of today(05-02-2020) is not being updated.
Watch levels for next decisive moves confirmations
Intra Day Chart Analysis & Market Outlook
(04-02-2020)
Nifty-Intra Day Chart (03-Feb-2020):-
Just click on chart for its enlarged view
Technical Patterns formation in today intraday charts

1- Up moves in Bearish Rising Channels
2- Selling between 11616-11749
3- Support between 11648-11705
4- Up moves in Bearish Rising Channel
5- Whole day actual trading between 11615-11749

Conclusions from intra day chart analysis 

As both selling and consolidation patterns formations therefore whole day today trading will be understood with Mixed Patterns formation between 11615-11749 hence firstly Nifty will trade and prepare for next decisive moves within this range tomorrow and finally sustaining it beyond should be watched for next decisive moves confirmations. 
Strong rally after Global markets recovery from Corona virus fear
Technical Analysis,Research & Weekly Outlook
(Feb 03 to Feb 07,2020)
Nifty-EOD Chart Analysis
(5th Wave structure)
Nifty-EOD Chart (01-Feb-2020):-
Just click on chart for its enlarged view
Technical Patterns and Formations in EOD charts

1- Impulsive Wave-i of Wave-5 beginning at 10004.55 on 26-10-2018 after Wave-4 completion
2- Wave-i of Wave-5 completion at 12103.00 on 03-06-2019 and corrective Wave-ii beginning
3- Corrective Wave-ii of Wave-5 completion at 10637.10 on 23-08-2019 and impulsive Wave-iii beginning
4- Impulsive Wave-iii of Wave-5 completion at 12430.50 on 20-01-2020 and its correction continuation
5- Correction continuation with recent bottom formation at 11633.30 on 01-02-2020 
6- First signal of deeper correction through Nifty testing 200 Day SMA(today at 11654.90) on 01-02-2020

Nifty-Fibonacci Retracement levels of Wave-5
Nifty-EOD Chart (01-Feb-2020):-
Just click on chart for its enlarged view
Technical Patterns and Formations in EOD charts

1- Nifty-Fibonacci Retracement levels of Wave-5(10004-12430)
2- 27% Retracement has been completed

Nifty-Intra Day Chart Analysis (01-Feb-2020)
Nifty-Intra Day Chart (01-Feb-2020):-
Just click on chart for its enlarged view
Technical Patterns formation in today intraday charts

1- 4 Hours selling between 11900-12017
2- Follow up selling between 11808-111842
3- 175 Points slipping in last hour
4- Whole day actual trading between 11633-12017

Conclusions from EOD chart analysis 

1- Long Term Trend is at stake after Nifty testing its decider 200 Day SMA(today at 11654.90) on 01-02-2020.
2- Intermediate Term Trend down.
3- Short Term Trend is down.

Conclusions from Fibonacci Retracement levels analysis 

Nifty-Fibonacci Retracement levels of Wave-5(10004-12430):-

1- 13.0%-12114 (Retraced)
2- 23.6%-11857 (Retraced)
3- 27.0%-11775 (Retraced)
4- 38.2%-11503 (Crucial)
5- 50.0%-11217 (Crucial)
6- 61.8%-10930 (Crucial)
7- 70.7%-10714
8- 76.4%-10576
9- 78.6%-10523 
10-88.6%-10280 

Conclusions from intra day chart analysis 

As Dow Jones closed more than 600 points down last Friday therefore Nifty slipped 75 points in first 15 seconds after gap down opening and after that slow up moves remained continued till Budget speech opening.

As Budget enthusiasm therefore selling was done on the back of Budget led heated sentiments and down moves started after 1 PM. Again follow up selling between 11808-111842 after some up moves and finally 175 Points slipping in last hour as well as closing at the lowest of Union Budget day after loosing 300 points.

Certainly huge selling therefore until complete consolidation will not develop till then Nifty will not moves above day's highest(12017) but some up moves may be seen up to 11808

Conclusions (After Putting All Studies Together)

Crucial Simple Moving Averages are as follows:-

5 Day SMA is today at-11969
13 Day SMA is today at-12123
55 Day SMA is today at-12109
200 Day SMA is today at-11654

As Nifty tested Long Term Trend decider 200 Day SMA(today at 11654.90) on 01-02-2020 and closed just above it at 11661.85 on Union Budget like day therefore too much depression of sentiments will be understood but Corona virus spreading fear was also one of the reason of such big fall therefore firstly sustaining beyond 200 Day SMA and Global markets reaction on Corona virus should be watched for the life of Long Term Trend.  

27.0% retracement has been completed and Short Term Indicators have also turned Oversold therefore some up moves towards following resistances can not be ruled out and until Nifty will sustain above 12216 till then correction completion will not be considered.

1- 11808-111842
2- 11900-12017
3- 12003-12048
4- 12125-12169
5- 12160-12216

Union Budget 2-020-21 is good enough and Indian markets are following Corona virus led Global markets weakness,let world recover from this disease then strong rally will be seen in Indian markets also.  
Watch levels for up moves confirmations amid Corona virus spreading fear
Intra Day Chart Analysis & Market Outlook
(01-02-2020)
Nifty-Intra Day Chart (31-Jan-2020):-
Just click on chart for its enlarged view
Technical Patterns formation in today intraday charts

1- Down moves in Bullish Falling Channel
2- Slow up moves in Mid-session
3- Selling between 12003-12048
4- Sharp fall in last hour
5- Whole day actual trading between 11946-12103

Conclusions from intra day chart analysis 

Although 65 points positive opening but not sustaining at higher levels because Corona virus spreading news and market started slipping. 

As firstly down moves were in Bullish Falling Channel therefore some up moves were seen in Mid-session which were slow hence selling was seen between 12003-12048 and resultant sharp fall in last hour.

Tomorrow is Budget 2020-21 day which may generate some optimism if positive announcements but sentiment is too much depressed due to negative news from Corona virus front and today closing was at 30 days lowest therefore more down moves gates are very much open and until Nifty will not close above following resistances till then fresh rally will not be considered.

1- 12003-12048
2- 12125-12169
3- 12160-12216
Sharp rally any day
Intra Day Chart Analysis & Market Outlook
(31-01-2020)
Nifty-Intra Day Chart (30-Jan-2020):-
Just click on chart for its enlarged view
Technical Patterns formation in today intraday charts

1- Slipping 52 points in first 30 seconds
2- Down moves in Bullish Falling Channel
3- Consolidation between 12011-12046
4- Whole day actual trading between 12011-12150

Conclusions from intra day chart analysis 

As most Asian markets were trading more than 1% down and some were more than 3% weak and Dow Jones's Futures was also trading after loosing more than 200 points therefore slippinmg 52 points in first 30 seconds but after that more than 4 hours trading was with Down moves in Bullish Falling Channel and lower levels consolidation was seen between 12011-12046 in last 2 hours therefore Indian markets will be understood well prepared for sharp rally which may be seen any day because Short Term indicators have turned Over sold and whole day good intraday consolidation today.

Crashing like situation in most Global markets due to Corona virus fear therefore firstly sustaining beyond 12011-12046 should be watched in the coming sessions for rally beginning confirmations.
Watch levels amid up moves expectation
Intra Day Chart Analysis & Market Outlook
(30-01-2020)
Nifty-Intra Day Chart (29-Jan-2020):-
Just click on chart for its enlarged view
Technical Patterns formation in today intraday charts

1- Up moves with corrections
2- Down moves in Bullish Falling Channel
3- Selling between 12125-12169
4- Volatility in Mid Session
5- Support between 12113-12137
6- Whole day actual trading between 12104-12169

Conclusions from intra day chart analysis 

Although firstly some consolidation through Up moves with corrections and Down moves in Bullish Falling Channel but higher levels selling also between 12125-12169 therefore down moves and Volatility was seen in Mid Session. 

As some supports was also seen in last hour between 12113-12137 therefore whole day trading will be understood with Mixed Patterns formation between 12104-12169 and firstly sustaining it beyond should be watched for next decisive moves beginning amid up moves expectation after fresh consolidation.
Fresh rally after some more correction towards next supports
Intra Day Chart Analysis & Market Outlook
(29-01-2020)
Nifty-Intra Day Chart (28-Jan-2020):-
Just click on chart for its enlarged view
Technical Patterns formation in today intraday charts

1- More than 5 hours selling between 12102-12163(Immediate Resistances)
2- Down moves in Bullish Falling Channel
3- Whole day actual trading between 12025-12163

Conclusions from intra day chart analysis 

Although more than 5 hours selling between 12102-12163 but after this Down moves were in Bullish Falling Channel therefore little recovery was seen from lower levels in last half hour.

As more than 5 hours selling therefore more down moves below today lowest can not be ruled out but some consolidation was also seen through Down moves in Bullish Falling Channel therefore expected that follow up consolidation will develop within or near about next supports(11930-12000) and fresh rally may begin any day which may be sharp also.
A correction in today Outlook
Right selling range is as follows:-
1- More than 5 hours selling between 12160-12216(Immediate Resistances)

Correction continuation towards next supports
Intra Day Chart Analysis & Market Outlook
(28-01-2020)
Nifty-Intra Day Chart (27-Jan-2020):-
Just click on chart for its enlarged view
Technical Patterns formation in today intraday charts

1- More than 5 hours selling between 12108-12216(Immediate Resistances)
2- Slipping in last hour
3- Whole day actual trading between 12108-12216

Conclusions from intra day chart analysis 

As death toll rises due to Corona viruses and its spreading also all around wourd therefore Dow Jones's Futures was trading more than 200 points down today morning and resultant weaker opening of Indian markets.

Firstly more than 5 hours selling between 12108-12216 and after that slippping till last minutes as well as no consolidation patterns formations therefore correction will remain continued.

Next supports are above 12088 and once sustaining below it will mean Correction continuation towards next supports(11930-12000) and it is expected also.
समस्त हिन्दुस्तानियों को गणतंत्र दिवस की हार्दिक शुभकामनाएं

Firstly watch levels amid Budget expectations and Corona virus fear
Technical Analysis,Research & Weekly Outlook
(Jan 27 to Feb 01,2020)
Nifty-EOD Chart Analysis
(5th Wave structure)
Nifty-EOD Chart (24-Jan-2020):-
Just click on chart for its enlarged view
Technical Patterns and Formations in EOD charts

1- Impulsive Wave-i of Wave-5 beginning at 10004.55 on 26-10-2018 after Wave-4 completion
2- Wave-i of Wave-5 completion at 12103.00 on 03-06-2019 and corrective Wave-ii beginning
3- Corrective Wave-ii of Wave-5 completion at 10637.10 on 23-08-2019 and impulsive Wave-iii beginning
4- Impulsive Wave-iii of Wave-5 continuation with recent top formations at 12430.50 on 20-01-2020

Nifty-Last 12 Sessions intraday charts analysis
Nifty-Intra Day Chart (Jan 09 to Jan 24,2020):-
Just click on chart for its enlarged view
Technical Patterns formation in last 12 Sessions intraday charts

1- Last 12 sessions sideways trading between 12088-12430 with lower lower levels supports and higher levels selling.
2- 12 Sessions actual trading between 12088-12430

Nifty-Intra Day Chart Analysis 
(24-Jan-2020)
Nifty-Intra Day Chart (24-Jan-2020):-
Just click on chart for its enlarged view
Technical Patterns formation in today intraday charts

1- Up moves with downward corrections
2- More than 5 hours trading with Mixed Patterns formation between 12216-12272
3- Whole day actual trading between 12150-12272

Conclusions from EOD chart analysis 

1- Long Term Trend is up.
2- Intermediate Term Trend is sideways between 12088-12430 for the last 12 sessions.
3- Short Term Trend is up.

Conclusions from 12 Sessions intra day chart analysis 

As last 12 sessions sideways trading between 12088-12431 with lower levels supports and higher levels selling therefore Nifty will firstly trade and prepare for next big moves in the coming week and finally sustaining beyond this range will confirm big moves beyond this range which will be seen just before or after Budget in next week.

Conclusions from intra day chart analysis 

Although sharp up moves after opening but more than 5 hours trading was with Mixed Patterns formation between 12216-12272 therefore Nifty will firstly trade and prepare within this range for next decisive moves in the beginning of coming week and finally sustaining beyond this range will generate first strong signal of next big moves.

Conclusions (After Putting All Studies Together)

Indian markets are Bullish and now Impulsive Wave-iii of Wave-5 continuation with minimum target above 12700 which may be seen seen just before or after Budget.

Now Corona virus fear is spreading in all the Global markets and many have started tumbling due to uncertainty but Indian markets out performed and closed in Green in both previous sessions. If Corona virus problem deepens then Indian markets will also not remain untouchable and may moves down.  

Certainly Indian markets have shown technical strength but will roll between Budget expectations and Corona virus fear in next week and finally sustaining beyond last 12 sessions trading range(12088-12430) will confirm next trend which should be watched for:-

1- Above 12430 will mean rally above 12700
2- Below 12088 will mean Correction towards and below next supports 11930-12000
Firstly Watch levels amid Corona virus fear and technical strength of Indian markets  
Intra Day Chart Analysis & Market Outlook
(24-01-2020)
Nifty-Intra Day Chart (23-Jan-2020):-
Just click on chart for its enlarged view
Technical Patterns formation in today intraday charts

1- Firstly 81 points sharp recovery from lower levels
2- Down moves in Bullish Falling Channel
3- Up moves with small intraday corrections
4- More than 2 hours trading with Mixed Patterns formation between 12163-12189 
5- Whole day actual trading between 12095-12189

Conclusions from intra day chart analysis 

As news of Corona virus spreading in China today morning therefore most Asian markets were too much weak and Dow's Futures was also trading more than 75 points hence sentiment was depressed and resultant Nifty slipping after positive opening.

Although such dampened mood but firstly 81 points sharp recovery from lower levels. Nifty could not sustain at higher levels and again slipped into negative zone but these down moves were in Bullish Falling Channel which was a positive signal. 

As MId-session up moves were with small intraday corrections therefore signals of more up moves but last more than 2 hours trading were with Mixed Patterns formation between 12163-12189 hence follow up consolidation is also required for sustaining above today highest.

Next supports are between 12090-12110
Next supports are between 12190-12220

Although Indian markets have shown strength and out performed all the Global markets today but Dow Jones traded more then 200 points down today and all the European markets also closed much weaker due to Corona virus spreading fear therefore sustaining beyond above mentioned supports and resistances(12090-12220)should be watched in the coming sessions for next decisive moves beginning because Indian markets are technically prepared for rally but Corona virus repercussions are not known to us.
As still busy therefore Stock Market Outlook of today(23-01-2020) is not being updated but tomorrow Outlook will be posted positively.
As busy therefore Stock Market Outlook of today(22-01-2020) is not being updated.
Correction continuation towards next supports
Intra Day Chart Analysis & Market Outlook
(21-01-2020)
Nifty-Intra Day Chart (20-Jan-2020):-
Just click on chart for its enlarged view
Technical Patterns formation in today intraday charts
1- Slipping 55 points in first minute after gap up opening
2- Down moves continuation
3- More than 4 hours selling between 12238-12320(Immediate Resistances)
4- Whole day actual trading between 12217-12430

Conclusions from intra day chart analysis 

Following lines were told on 18-01-2020 in "Good Budget will mean strong rally towards 13870.95":-

1- As Short Term indicators have turned overbought and Oscillators are also showing negative divergence therefore emergence of Short Term correction possibility
2- Nifty traded sideways within 110 points between 12279-12389 in last 5 sessions of previous week which is a signal of time wise correction beginning and that may remain continued in next week also

Correction continuation possibility was told on 18-01-2020 for this week and that seen today 

Although gap up opening but Nifty slipped 55 points in first minute and after that whole day down moves with more than 4 hours selling between 12238-12320 as well as closing below last 5 sessions trading range(12279-12389) therefore today started correction will remain continued and until Nifty will not sustain above 12320 after complete consolidation till then decisive up moves will not be seen.

As next supports are lying above 11960 therefore correction should stop above or near about it and Nifty will prepare for Post Budget decisive moves within 11960-12279 in the coming weeks. 

Complete fresh consolidation is required for next rally beginning and that will be finally seen also but before that correction continuation is expected towards next supports(11960).
Good Budget will mean strong rally towards 13870.95
Technical Analysis,Research & Weekly Outlook
(Jan 20 to Jan 24,2020)
Nifty-EOD Chart Analysis
(Waves structure)
Nifty-EOD Chart (17-Jan-2020):-
Just click on chart for its enlarged view
Technical Patterns and Formations in EOD charts

1- Impulsive Wave-1 beginning from 6825.80 on 29-02-2016 after 1 financial year(2015-16) correction completion.
2- Impulsive Wave-1 completion at 8968.70 on 07-09-2016 and corrective Wave-2 beginning
3- Corrective Wave-2 completion at 7893.80 on 26-12-2016 and impulsive Wave-3 beginning
4- Impulsive Wave-3 completion at 11760.20 on 28-08-2018 and corrective Wave-4 beginning
5- Corrective  Wave-4 completion at 10004.55 on 26-10-2018 and impulsive Wave-5 beginning
6- Impulsive Wave-5 continuation with new life time high formation at 12389 on 16-01-2020

Nifty-Last 5 Sessions intraday charts analysis
Nifty-Intra Day Chart (Jan 13 to Jan 17,2020):-
Just click on chart for its enlarged view
Technical Patterns formation in last 5 Sessions intraday charts

1- Last 5 sessions sideways trading within 110 points between 12279-12389 with lower lower levels supports,higher levels selling and Mixed Patterns formation.
2- 5 Sessions actual trading between 12279-12389

Nifty-Intra Day Chart Analysis
(17-Jan-2020)
Nifty-Intra Day Chart (17-Jan-2020):-
Just click on chart for its enlarged view
Technical Patterns formation in today intraday charts

1- Sharp up after weak opening
2- Selling between 12370-12385
3- More than 4 hours trading with Mixed Patterns formation between 12345-12371
4- Whole day actual trading between 12322-12385

Conclusions from EOD chart analysis 

1- Long Term Trend is up.
2- Intermediate Term Trend is up.
3- Short Term Trend is sideways between 12279-12389 for the last 5 sessions.

Conclusions from 5 Sessions intra day chart analysis 

Following lines were told in previous Weekly Outlook(Jan 10 to Jan 17,2020) on 11-01-2020 in "Finally rally continuation after Very Short Term correction":-

finally on going rally continuation will be expected after Very Short Term sideways time wise correction

Very Short Term sideways time wise correction was  told for this week and Nifty corrected sideways in all 5 previous sessions of this week between 12279-12389.

As last 5 sessions trading was with lower lower levels supports,higher levels selling and Mixed Patterns formation between 12279-12389 therefore Nifty will firstly trade and prepare for next trend within and near about this range as well as finally sustaining beyond this range will form next Short/Intermediate Term Trend which should be watched in next week for confirmations.

Conclusions from intra day chart analysis 

Although sharp up moves were seen after weaker opening but higher levels selling developed therefore slipped into negative zone and last more than 4 hours trading with Mixed Patterns formation was seen between 12345-12371.

As firstly  volatility and after that Mixed Patterns formation therefore one sided trading positions formations will not be considered and firstly Nifty will have to trade and prepare for next decisive moves within and near about this range as well finally valid break out of last Friday trading range(12322-12385) will generate first strong signal of next trend.

Conclusions (After Putting All Studies Together)

Impulsive Wave-5 is on and Nifty is moving towards its maximum target at 13870.95.

Calculation of maximum target of Nifty at 13870.95 is as follows:-  
Impulsive Wave-1 gained=2142.90 points(8968.70-6825.80)
Impulsive Wave-3 gained=3866.40 points(11760.20-7893.80)
Impulsive Wave-5 has gained 2154.25 points till 28-11-2019(12158.80-10004.55)

As according to Elliott Wave theory Wave-5 can not gain more points than Wave-3 gained therefore on going impulsive Wave-5 will gain lesser points than 3866.40.

Impulsive Wave-5 started from 10004.55 on 26-10-2018 and it has to gain less than 3866.40 points therefore maximum target of on going impulsive Wave-5 is 13870.95(10004.55+3866.40)

Bulls are ruling in Indian Stock Markets and new life time highest was formed last Thursday. As no selling pattern formation on EOD charts till now therefore technically on going rally continuation will be considered and until complete selling patterns will not develop on EOD charts till then any deeper correction will not be seen.

As Short Term indicators have turned overbought and Oscillators are also showing negative divergence therefore emergence of Short Term correction possibility. Nifty traded sideways within 110 points between 12279-12389 in last 5 sessions of previous week which is a signal of time wise correction beginning and that may remain continued in next week also. In fact Indian markets are now preparing for post Union Budget 2020-21 moves and now first indication of those moves will be derived from sustaining beyond last 5 sessions trading range(12279-12389).

As on going impulsive Wave-5 may move up to 13870.95 therefore good Budget on 1st Feb 2020 will mean strong rally will be seen towards it and before that nifty may prepare within and near about last 5 sessions trading range(12279-12389).
Levels will confirm next big decisive moves
Intra Day Chart Analysis & Market Outlook
(17-01-2020)
Nifty-Intra Day Chart (16-Jan-2020):-
Just click on chart for its enlarged view
Technical Patterns formation in today intraday charts

1- Selling between 12364-12389
2- Up moves with corrections
3- Down moves in Bullish Falling Channel
4- Whole day actual trading between 12316-12389

Conclusions from intra day chart analysis 

Following lines were told in Weekly Outlook(Jan 10 to Jan 17,2020) on 11-01-2020 in "Finally rally continuation after Very Short Term correction":-

finally on going rally continuation will be expected after Very Short Term sideways time wise correction

Very Short Term sideways time wise correction was  told for this week and Nifty is correcting sideways in all 4 previous sessions of this week between 12279-12389.

Following lines were told yesterday in "Levels will confirm next decisive moves after US-China trade deal ":-

firstly sustaining beyond 12279-12355 should be watched tomorrow for next decisive moves after trade deal actual impact on Indian industry and Stock Markets.

As good news of US-China trade deal therefore moved up firstly but could not sustain above and closed exactly at 12355.50 after slipping to 12,315.80

Although firstly up moves after flat opening but higher levels selling developed therefore slipping from higher levels. As last 4 hours up moves were with intraday corrections and last hour Down moves in Bullish Falling Channel therefore some consolidation will also be considered.

As both higher levels selling and lower levels consolidation today therefore Nifty will firstly trade within last 4 sessions trading range(12279-12389) and finally sustaining beyond this range will generate next big decisive moves.