Nifty-Indicators Analysis in Daily Chart(08-Feb-2012):-
1- Three days sideways market.
2- Bollinger Band is continuously moving along with Upper Band and showing maturity of up trend.
3- All indicators are either in overbought zone or just below and showing possibility of correction to cool down indicators. .
4- Divergence in overbought zone also and showing that market which is prepared for correction also.
5- ADX is above 60 and near its peaking level.
Nifty-Intra Day Chart(Feb 06 to Feb 08,2012):-
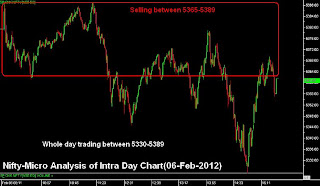
1- Selling between 5365-5395
2- Support between 5322-5355
3- Three days trading between 5322-5395
889 Nifty points rally and above mentioned signals are suggesting that Indian markets are preparing for correction. As Running rallies corrects within sideways markets therefore this possibility will be firstly kept in mind:-
1- As good selling at higher levels in last 3 sessions therefore until Nifty will not sustain above 5395 till then further rally will not be considered.
2- As lower levels supportsnabove 5322 also seen in last 3 sessions therefore correction completion possibility between sideways moves is still alive.
Indian markets are almost mature for correction and sustaining above 5322 will be firstly watched but its breaking down will mean that short term correction which may be deep also.
As good selling at higher levels in last 3 sessions and 889 Nifty points rally require sufficient correction therefore expected that Nifty will slip below 5322 and posssibility of next support testing near 5250/5100 can not be ruled out.
Last 3 sessions trading between 5322-5395 and sustaining beyond this range will finally reply all questions regarding expected correction therefore it is next moves confirmation range and should be firstly watched.
 |
| Just click on chart for its enlarged view |
Indicators analysis in Daily chart
1- Three days sideways market.
2- Bollinger Band is continuously moving along with Upper Band and showing maturity of up trend.
3- All indicators are either in overbought zone or just below and showing possibility of correction to cool down indicators. .
4- Divergence in overbought zone also and showing that market which is prepared for correction also.
5- ADX is above 60 and near its peaking level.
Nifty-Micro Analysis of 3 days Intra Day Chart(Feb 06 to Feb 08,2012)
Nifty-Intra Day Chart(Feb 06 to Feb 08,2012):-
 |
| Just click on chart for its enlarged view |
Technical Patterns and Formations in last 3 sessions intraday charts
1- Selling between 5365-5395
2- Support between 5322-5355
3- Three days trading between 5322-5395
Conclusions (After Putting All Indicators Together)
889 Nifty points rally and above mentioned signals are suggesting that Indian markets are preparing for correction. As Running rallies corrects within sideways markets therefore this possibility will be firstly kept in mind:-
1- As good selling at higher levels in last 3 sessions therefore until Nifty will not sustain above 5395 till then further rally will not be considered.
2- As lower levels supportsnabove 5322 also seen in last 3 sessions therefore correction completion possibility between sideways moves is still alive.
Indian markets are almost mature for correction and sustaining above 5322 will be firstly watched but its breaking down will mean that short term correction which may be deep also.
As good selling at higher levels in last 3 sessions and 889 Nifty points rally require sufficient correction therefore expected that Nifty will slip below 5322 and posssibility of next support testing near 5250/5100 can not be ruled out.
Last 3 sessions trading between 5322-5395 and sustaining beyond this range will finally reply all questions regarding expected correction therefore it is next moves confirmation range and should be firstly watched.


