ॐ ह्रीं श्रीं लक्ष्मीभयो नमः॥


Trading "calls" from our "Software" with more than "90% accuracy"

 This is the "Oldest & Only Website" of whole World
which is updating Nifty & Indian Stock Markets
"Daily and Weekly accurate Outlooks" 
with "Intraday Charts Analysis"for the 
last more than "14 years" means from "2010"
For its live Proofs just see "Archive"
in the "bottom of this Website".

Nifty-Micro Analysis of Intra Day Chart(23-05-2011)


Nifty- Intra Day Chart(23-05-2011):-
Just click on chart for its enlarged view
Main Features

1- Selling between 5418-5436
2- Last 3 hours mixed patterns between 5375-5400

Conclusions

All trends are down and all the technical indicators are suggesting Bearish markets. Last confirmation point is sustaining below 5444. Nifty traded whole day below it and also moved bolow strong support(5402).

As today down moves were the impact of crashing global markets therefore clear selling patterns are required below 5402 for Bearish markets confirmations. Nifty traded last 3 hours between 5375-5400 but patterns are mixed and if Nifty sustains below 5375 tomorrow then deep down will be seen.

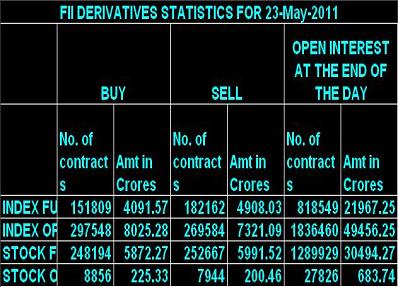
FII Trading Data in Derivatives Segment on 23-May-2011


FII & DII trading activity in Capital Market Segment on 23-May-2011

FII trading activity on NSE and BSE in Capital Mayket Segment(In Rs. Crores)
CategoryDateBuy ValueSell ValueNet Value
FII23-May-20111959.212252.77-293.56


DII trading activity on NSE and BSE in Capital Mayket Segment(In Rs. Crores)
CategoryDateBuy ValueSell ValueNet Value
DII23-May-20111070875.78194.22

Indian Stock Markets Closing Reports(23-05-2011)


Main features of today trading are as follows

1- Global cues led deep Red closing today.
2- Nifty traded more than 3 hours below 5400.
3- All the Indices closed in Red except FMCG and CD.

Ratios

Nifty Put Call Ratio: 0.91
Nifty P/E Ratio(20-05-2011): 20.34

Advances & Declines

BSE ADVANCES : 813
BSE DECLINES : 1976
NSE ADVANCES : 252
NSE DECLINES : 41

Nifty Open Interest Changed Today

Nifty- 5300 CE(26-05-2011)- +1096650(+442.73%)
Nifty- 5300 PE(26-05-2011)- +595250(+9.80%)

Nifty- 5400 CE(26-05-2011)- +2919000(+76.16%)
Nifty- 5400 PE(26-05-2011)- -1014600(-12.74%)

Nifty- 5500 CE(26-05-2011)- +1030400(+15.64%)
Nifty- 5500 PE(26-05-2011)- -1167050(-20.86%)

Closing

Nifty- closed at 5,386.55(-99.80 Points & -1.82%%)
Sensex- closed at 17,993.33(-332.76 Points & -1.82% )
CNX MIDCAP - closed at 7,774.15 (-99.00 Points & -1.26%)
BSE SMALL CAP- closed at 8,057.02(-128.16 Points & -1.57%)

Nifty Spot-Levels & Trading Strategy for 24-05-2011

Nifty Spot-Levels


R3 5520
R2 5488
R1 5437
Avg 5405
S1 5354
S2 5322
S3 5271


Nifty Spot-Trading Strategy

H6   5469   Trgt 2
H5   5450   Trgt 1
H4   5431   Long breakout
H3   5408   Go Short
H2   5401
H1   5393
L1   5378
L2   5370
L3   5363   Long
L4   5340   Short Breakout
L5   5321   Trgt 1
L6   5302   Trgt 2

Bank Nifty(May Fut)-Levels & Trading Strategy for 24-05-2011

Bank Nifty(May Fut)-Levels

R3 10797
R2 10698
R1 10528
Avg 10429
S1 10259
S2 10160
S3 9990

Bank Nifty(May Fut)-Trading Strategy

H6 10627 Trgt 2
H5 10566 Trgt 1
H4 10505 Long breakout
H3 10431 Go Short
H2 10407
H1 10382
L1 10333
L2 10308
L3 10284 Long
L4 10210 Short Breakout
L5 10149 Trgt 1
L6 10088 Trgt 2

Nifty(May Fut)-Levels & Trading Strategy for 24-05-2011

Nifty(May Fut)-Levels

R3 5501
R2 5470
R1 5426
Avg 5395
S1 5351
S2 5320
S3 5276

Nifty(May Fut)-Trading Strategy

H6  5458   Trgt 2
H5  5441    Trgt 1
H4  5424    Long breakout
H3  5403    Go Short
H2  5396
H1  5389
L1  5376
L2  5369
L3  5362    Long
L4  5341    Short Breakout
L5  5324    Trgt 1
L6  5307    Trgt 2

Pre-closing Outlook(23-05-2011)

Dow's Futures is more than 150 points down today therefore sentiment is depressed and all the Asian markets closed in deep Red today.Indian markets are could not survived and Nifty slipped and trading below 5400 also.

As soon as selling started to develop then it was informed and following line was clearly  told at 09:52 AM today in Post-open Outlook(23-05-2011):-

"Weak opening and first half hour intraday charts selling patterns"

As sentiment is news based and completely depressed therefore sustaining below 5400 require more confirmations. Nifty is trading between 5375-5400 for the last 3 hours and dipping below 4375 will mean begining of deep down and sustaining above 5400 will mean survival of bullush markets hopes.

Post-open Outlook-2(23-05-2011)

Today weak opening and first hour trading between 5419-5436 with first half hour selling patterns. Strong support range is 5402-5431 and Nifty is trading within and little above this range. Although first half hour intraday sellng patterns but market requires complete selling patterns for Nifty below 5400.

As today weakness is global cues based,sentiment is extremely deprssed therefore voltality may also be seen. Sometimes markets get support in today like depressed sentiments therefore sustaining beyond 5400-5440  will be watched for next immediate move confirmations.

Let market prepare and intraday charts mature for next moves then final conclusions will be drawn.

Post-open Outlook(23-05-2011)


Weak opening and first half hour intraday charts selling patterns.

Pre-open Outlook(23-05-2011)


Technical Positions,today Outlook and next possibilities have already been posted in following topic with 1 Chart therefore not repeated today:-

"Weekly Outlook(May 23 to May 27,2011)"

Dow's Futures is more than 80 points down today and  US markets closed  weak last Friday therefore sentiment is depressed and all the Asian markets are in deep Red today morning. Indian markets are already range bound with strong support between 5402-5431 and good selling at higher levels also therefore weak opening and firstly trading between 5420-5460 expected.

Most of the time Red zone trading expected and Red closing may also be seen but intraday chart formation of today will decide coming sessions markets. Let Indian markets prepare then next moves will be decided according to today intraday charts patterns.

Weekly Outlook(May 23 to May 27,2011)

Detailed Technical Analysis and Researches have been posted in following 5 topics with EOD and Daily Charts and technical reasons for next moves have been explained:-

1- Nifty-Averages and Indicators Analysis
2- Nifty-Elliot Waves Structure
3- Nifty- Correction in Continuation pattern Pennant Formations
4- Nifty-Micro Analysis of 10 Days Intra Day Chart
5- Nifty-Micro Analysis of Intra Day Chart(20-05-2011)

Conclusions (After Putting All Studies Together)

Nifty is sustaining below 50(5619) and 200 DaY EMA(5616) for the last 14 sessions therefore Intermediate and long term trends are down. Diwali 2010 started correction was in the form of 'ABC' Correction and this correction has been completed at 5177 and after its completion 4th corrective wave has also completed. 5th impulsive wave is on and it is in the form of Rising Trend Line of Pennant but it was broken down last week,Nifty  nicely consolidated 4 days below it and after that strong upmove seen last Friday.

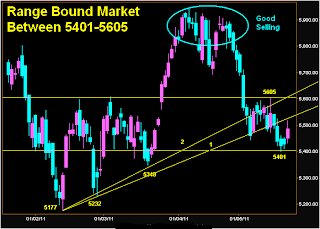
Range Bound Market Between 5401-5605 Chart
Just click on chart for its enlarged view
Nifty is trading between 5401-5605 for the last 14 sessions. Supports and Resistances within this range are as follows;-

1- Support and Base formation between 5402-5431
2- Minor selling between 5505-5517
3- Resistance between 5520-5530
3- Resistance between 5540-5605

Huge selling above this range. Supports below that range are as follows;-

1- 5348
2- 5232
3- 5177
Strong lower levels consolidations in previous week but resistances at higher levels are also equally strong. Indian markets have to prepare for next sustained and decisive moves and it will be done in first couple of sessions within 5444-5500. Indian markets are preparing for next moves between 5401-5605 and sustaining beyond this range will be next moves confirmations. As market is not trending but range bound therefore next trend view will be formed according to coming sessions intraday charts patterns.

As Wave-5 and continuation pattern Pennant are intact therefore upmoves hopes are still alive and also expected that Indian markets will consolidate in the coming sessions and upward break out will be seen in the coming week..

Nifty-Micro Analysis of Intra Day Chart(20-05-2011)

Nifty-Intra Day Chart(20-05-2011)
Just click on chart for its enlarged view
Main Features

1- Consolidation patterns between 5452-5490
2- Minor selling between 5505-5517

Conclusions

3 Days base formation between 5402-5431 and then Consolidation patterns between 5452-5490 last Friday but good selling at higher levels also therefore market requires complete preparation for next moves in the coming sessions.

Nifty-Micro Analysis of 10 Days Intra Day Chart

Nifty- 10 Days Intra Day Chart (May 09 to May 20,2011)
Just click on chart for its enlarged view
Main Features

1- Strong Support between 5402-5431
2- Minor selling between 5505-5517 on 20-05-2011
3- Resistance between 5520-5530
3- Resistance between 5540-5605

Conclusions

Strong support and base formation between 5402-5431 in 3 days and then up move was seen on 20-05-2011 but minor selling also seen between 5505-5517. Next resistance is between 5520-5530 and minor seeling was seen exactly below it last Friday. In this manner now next resistance range is 5505-5530.

Selling at higher levels but strong base formations at crucial levels near 5400 and Nifty has sustained above 5444 also therefore Indian markets have to consolidate between 5444-5500 first in next week and then fresh upmoves will be possible.

Nifty- Correction in Continuation pattern Pennant Formations

ABC' Correction & pattern Pennant Formations Chart
Just click on chart for its enlarged view
Main Features

1-'ABC' Correction Completed
2- Correction in Continuation pattern Pennant Formations
3- Support at 5444
4- Previous closing at Rising Trend Line of Pennant

Conclusions

Correction started from Diwali 2010 day with formation of 'ABC' Correction,that has been completed at 5177 and after its completion 4th corrective wave has completed. 5th impulsive wave is on and it is Rising Trend Line of Pennant,it was broken down last week but Nifty  nicely consolidated 4 days below it and after strong upmove seen last Friday.

Pennant is continuation pattern as primary trend is still up therefore Pennant formation means that finally Nifty should cross and sustain above Falling Trend Line of Pennant. As Nifty closed exactly at at Rising Trend Line of Pennant trend line after trading above it last Friday therefore Pennant is still intact and its breaking down confirmation point will be slipping below 5401.

As Pennant is still intact therefore upmoves hopes are still alive.

Nifty-Elliot Waves Structure

Nifty-Elliot Waves Structure Daily Chart(20-05-2011)
Just click on chart for its enlarged view
Conclusions

Nifty moved below Wave-5 trend line but consolidated 4 days below it and closed exactly at Wave -5 trend line after trading above it last Friday therefore Wave 5 is still intact and its breaking down confirmation point will be slipping below 5401.

As Wave-5 is still intact therefore upmoves hopes are still alive.

Nifty-Averages and Indicators Analysis

Nifty-Averages and Very short term Indicators of Daily Chart(20-05-2011):-
Just click on chart for its enlarged view

Nifty is sustaining below 50 and 200 DaY EMA(5616) for the last 14 sessions therefore long term trend is down, both average lines are kissing and 50 DaY EMA downward crossing 200 DaY EMA will be more down moves confirmations.

Very Short term Indicators Slow Stochastic and William %R have moved above from Overbought zone after positive divergence therefore Indicating Upmoves in Short term.

Conclusions

Strong indications of short term up moves

Nifty Spot-Levels & Trading Strategy for 23-05-2011

Nifty Spot-Levels

R3 5609
R2 5563
R1 5524
Avg 5478
S1 5439
S2 5393
S3 5354

Nifty Spot-Trading Strategy

H6 5571     Trgt 2
H5 5552     Trgt 1
H4 5532     Long breakout
H3 5509     Go Short
H2 5501
H1 5493
L1 5478
L2 5470
L3 5462     Long
L4 5439     Short Breakout
L5 5419     Trgt 1
L6 5400     Trgt 2

Nifty(May Fut)-Levels & Trading Strategy for 23-05-2011

Nifty(May Fut)-Levels

R3 5622
R2 5572
R1 5528
Avg 5478
S1 5434
S2 5384
S3 5340

Nifty(May Fut)-Trading Strategy

H6  5578   Trgt 2
H5  5557    Trgt 1
H4  5535    Long breakout
H3  5509    Go Short
H2  5501
H1  5492
L1  5475
L2  5466
L3  5458    Long
L4  5432    Short Breakout
L5  5410    Trgt 1
L6  5389    Trgt 2

Bank Nifty(May Fut)-Levels & Trading Strategy for 23-05-2011

Bank Nifty(May Fut)-Levels

R3 10962
R2 10853
R1 10759
Avg 10650
S1 10556
S2 10447
S3 10353

Bank Nifty(May Fut)-Trading Strategy

H6  10871   Trgt 2
H5  10824   Trgt 1
H4  10777   Long breakout
H3  10721   Go Short
H2  10703
H1  10684
L1  10647
L2  10628
L3  10610   Long
L4  10554   Short Breakout
L5  10507   Trgt 1
L6  10460   Trgt 2

Nifty Spot-Weekly Levels & Trading Strategy(23-05 to 27-05-2011)

Nifty Spot-Weekly Levels

R3 5692
R2 5617
R1 5551
Avg 5476
S1 5410
S2 5335
S3 5269

Nifty Spot-Weekly Trading Strategy 

H6 5629     Trgt 2
H5 5596     Trgt 1
H4 5563     Long breakout
H3 5524     Go Short
H2 5511
H1 5498
L1 5473
L2 5460
L3 5447     Long
L4 5408     Short Breakout
L5 5375     Trgt 1
L6 5342     Trgt 2