Technical Analysis,Research & Weekly Outlook
(Jan 16 to Jan 20, 2012)
Nifty-Intra Day Chart(13-Jan-2011):-
 |
| Just click on chart for its enlarged view |
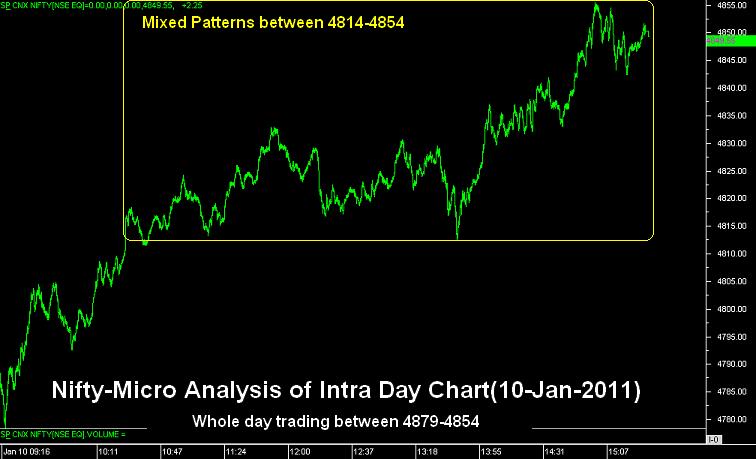
1- Support between 4835-4860
2- Mixed Patterns between 4875-4897
3- Whole day trading between 4835-4898
Conclusions from intra day chart analysis
Good support at lower levels but mixed intraday patterns at higher levels therefore more consolidation is required for crossing and sustaining above 4900.
Nifty-EOD Chart(13-Jan-2011):-
 |
| Just click on chart for its enlarged view |
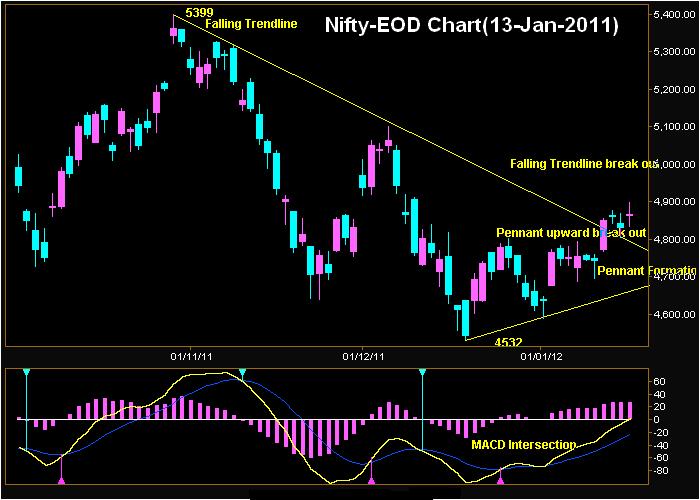
Technical Patterns and Formations in EOD charts
1- Pennant Formation
2- Pennant upward break out on 10-01 2011
3- Falling Trendline
4- Falling Trendline break out on 10-01 2011
5- Positive MACD
6- Doji Candle in 3 previous sessions.
7- MACD up ward intersected average line
Conclusions (After Putting All Studies Together)
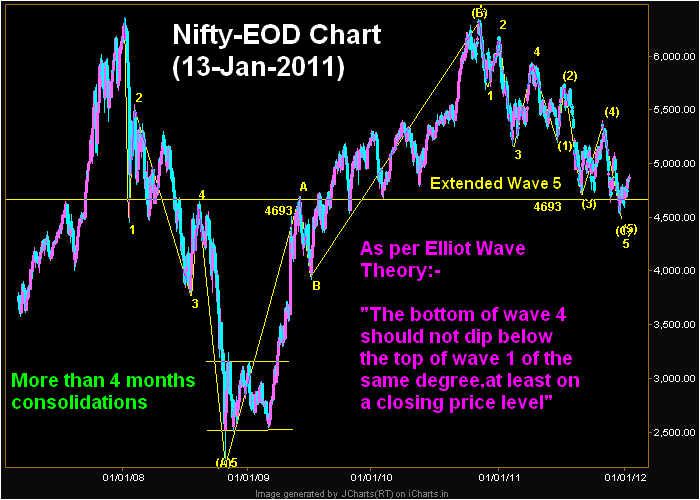
Long term and Intermediate term trends are down and short term trend is up at the bottom of 14 months long Corrective Wave 'C'. 4 Sub waves of corrective Wave 'C' has been completed and 5th Sub wave was extended in 5 Waves as well as its completion signal after beginning of rally on 20-12-2011 from 4531.15.
Rally is on after lower levels consolidations and showed strengh after Pennant and Falling Trendline break out on 10-01 2011 but correction also seen after selling on 11-01 2011. Technicals of 3 previous sessions are as follows:-
1- 3 Doji Candle formation
2- Both higher levels selling and lower levels buying in 3 previous sessions.
3- 3 days sideways trading between 4804-4898.
As both higher levels selling and lower levels buying in 3 previous session therefore markets are not prepared for anyside decisive moves and will firstly trade and prepare for next moves between last 3 days trading range(4804-4898) in the beginning of next week
As multiple resistances at higher levels therefore consolidation is required before any up move and it is going on for the last 3 sessions. Expected that on going Rally will remain continued after follow up consolidation in next week.