

Firstly watch Crucial Levels & Supports
one by one for next Trends formations
after Israel-Iran war escalation possibility
Technical Analysis,Research & Weekly
Outlook(Jun 16 to Jun 20,2025)
Nifty-EOD Chart Analysis
(Waves structure)
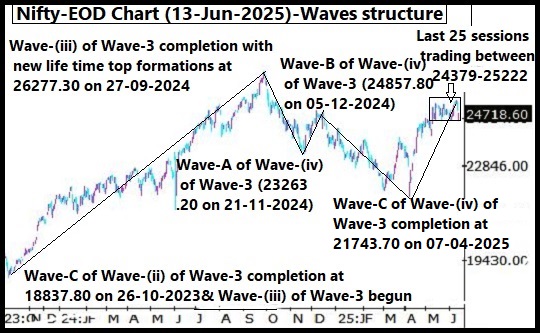
Nifty-EOD Chart (13-Jun-2025):-
Technical Patterns and Formations in EOD charts
1- Wave-C of Wave-(ii) of Wave-3 completion at 18837.80 on 26-10-2023 and impulsive Wave-(iii) of Wave-3 beginning.
2- Impulsive Wave-(iii) of Wave-3 completion with new life time top formations at 26277.30 on 27-09-2024 and Corrective Wave-A of Wave-(iv) of Wave-3 of "ABC" correction beginning.
3- Corrective Wave-A of Wave-(iv) of Wave-3 completion at 23263.20 on 21-11-2024.
4- Corrective Wave-B of Wave-(iv) of Wave-3 completion at 24857.80 on 05-12-2024.
5- Corrective Wave-C of Wave-(iv) of Wave-3 completion at 21743.70 on 07-04-2025 and Wave-(v) of Wave-3 beginning from this level.
6- Impulsive Wave-(v) of Wave-3 continuation with recent top formations at 25222.40 on 11-06-2025.
7- Last 25 sessions trading between 24379-25222.
Conclusions from EOD chart analysis
(Waves structure)
Impulsive Wave-(iii) of Wave-3 which begun after corrective Wave-C of "ABC" correction completion at 18837.80 on 26-10-2023 was completed with new life time top formations at 26277.30 on 27-09-2024 and corrective Wave-A of Wave-(iv) of Wave-3 started from this level.
Corrective Wave-A of Wave-(iv) of Wave-3 completed at 23263.20 on 21-11-2024 and Wave-B of Wave-(iv) of Wave-3 begun from this levels which completed at 24857.80 on 05-12-2024. From this levels corrective Wave-C of Wave-(iv) of Wave-3 started which completed at 21743.70 on 07-04-2025 and Wave-(v) of Wave-3 begun from this level. Now impulsive Wave-(v) of Wave-3 continuation with recent top formations at 25222.40 on 11-06-2025 and no confirmation of its completion yet on EOD charts. Last 25 sessions trading between 24379-25222 and finally sustaining beyond this range will confirm next bigger decisive moves beginning.
Nifty-EOD Chart Analysis
(Stochastic & MACD)
Nifty-EOD Chart (13-Jun-2025):-

Technical Patterns and Formations in EOD charts
1- Stochastic- %K(5) line has intersected %D(3) line downward and its both lines are falling from Over bought zone.
2- Stochastic:- %K(5)- 52.94 & %D(3)- 70.50.
3- In MACD- MACD line has intersected Average line downward and its both lines are falling in positive zone.
4- MACD(26,12)- 41.96 & EXP(9)- 60.96 & Divergence- -19.00
Conclusions from EOD chart analysis (Stochastic & MACD)
Technical positions of Short Term indicators are as follows:-
1- As in Stochastic its %K(5) line has intersected %D(3) line downward and its both lines are falling from Over bought zone therefore it will be understood that at present this indicator is suggesting more downward moves possibility in the coming week.
2- As in MACD indicator its MACD line has intersected Average line downward and its both lines are falling in positive zone therefore it will be understood that this indicator is confirming downward trend formations and resultant on going downward moves continuation possibility also.
Nifty-EOD Chart Analysis
(Averages)
Nifty-EOD Chart (13-Jun-2025):-

Technical Patterns and Formations in EOD charts
Averages:-
1- 5-Day SMA is today at 24991(Very Short Term Trend decider)
2- 21-Day SMA is today at 24841(Short Term Trend decider)
3- 55-Day SMA is today at 24214(Intermediate Term Trend decider)
4- 100-Day SMA is today at 23640
5- 200-Day SMA is today at 24082(Long Term Trend decider)
Conclusions from EOD chart analysis
(Averages)
As Nifty has closed well below Very Short Term and Short Term Trends deciding 5-Day and 21-Day SMAs last Friday therefore these 2 Trends are definitely down. In the same manner Nifty is well above Intermediate Term and Long Term Trends deciding 55-Day and 200-Day SMAs for the last more than 2 months therefore these 2 Trends are clearly up.
Nifty-Intra Day Chart Analysis &
Market Outlook(01-06-2025)
Nifty-Intra Day Chart (13-Jun-2025):-

Technical Patterns formation in today intraday charts
1- Upward moves with downward corrections
2- Upward moves in Bearish Rising Channel
3- Selling between 24703-24754
4- Whole day trading between 24473-24754
Conclusions from intra day
chart analysis
As Israel attacked on Iran and its Nuclear installations also on last Thursday night therefore at the opening time of Indian Stock markets Dow Jones futures was more than 600 points and all Asian markets were also trading in negative zone as well as some were more then 1% down therefore sentiment was completely depressed last Friday morning and Nifty opened 415 points down. Although gap down and such weaker opening but immediately upward moves started which remained continued till last hours and Nifty cloed near the the highest of the day therefore Green Marubozu candlestick formations was seen last Friday. As firstly consolidation pattern of "Upward moves with downward corrections" formation and same pattern was seen in Mid-Session also therefore upward moves remained continued despite distribution pattern of "Upward moves in Bearish Rising Channel" formations also. Higher levels good selling was also seen between 24703-24754 therefore firstly downward moves are expected towards last Friday lowest(24473) in the beginning of next week.
Conclusions (After putting
all studies together)
1- Short Term Trend is down.
2- Intermediate Term Trend is up.
3- Long Term Trend is up.
Impulsive Wave-1 of new Waves structure which started from 15183.40 on 17-06-2022 after corrective Wave-C of "ABC correction" of previous waves structure completion at this level is now in continuation through its impulsive Wave-(v) of Wave-3 which begun from 21743.70 on 07-04-2025 and now in continuation with its recent top formations at 25222.40 on 11-06-2025. Although no confirmation of Wave-(v) of Wave-3 completion yet on EOD charts but Nifty is trading between 24379-25222 for the last 25 sessions and finally sustaining beyond this range will confirm its continuation/completion.
Although Intermediate Term and Long Term Trends are now up but Short Term indicators are signalling downward moves continuation possibility and higher levels intraday selling was seen last Friday as well as Israel-Iran war escalation possibility also therefore firstly following crucial levels should be watched one by one for next Trends formations and accordingly that side bigger moves beginning confirmations:-
1- Last 25 sessions trading range(24379-25222) lowest at 24379.
2- Intermediate Term Trend decider 55-Day SMA which is today at 24214
3- Long Term Trend decider 200-Day SMA which is today at 24082
As Middle-East war situation escalates to extreme and correction begins below 24082 as well as Long Term Trend turns down then following next Supports will be watched one by one for next immediate moves beginning confirmations.:-
1- 23967-24058
2- 23873-23903(Gap Support)
3- 23785-23866
4- 23476-23529
5- 23354-23445
6- 23266-23346
7- 22924-23207(Gap Support)
8- 22770-22795
9- 22469-22695(Gap supports)
10- 22271-22424
11- 22254-22270(Gap supports)
12- 21987-22142(Strong supports)
13- 21825-21975
14- 21502-21582
15- 21417-21500


