ॐ ह्रीं श्रीं लक्ष्मीभयो नमः॥


Trading "calls" from our "Software" with more than "90% accuracy"

More than "12 years" old "only site of whole world" 
with more than "9700 accurate Outlooks" of 
"Indian Stock Markets" 

Indian Markets are at Key Supports Range

Technical Analysis and Research For 28-04-2012

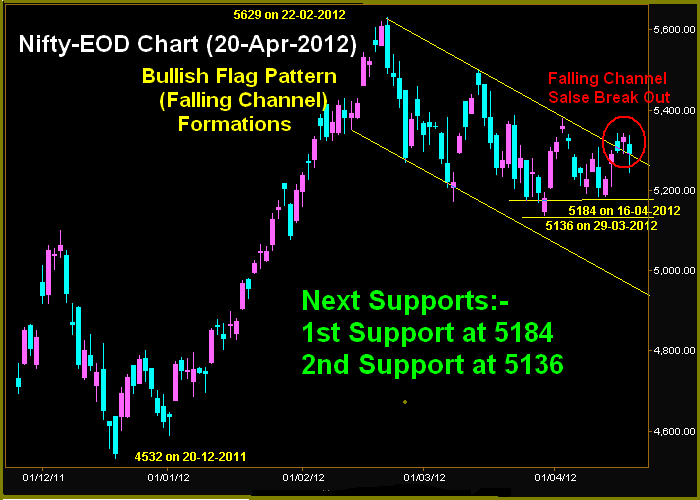
Nifty-EOD Chart (27-Apr-2012):-
Just click on chart for its enlarged view
Technical Patterns and Formations in EOD charts

1  Key supports range developed between 5136-5190 in last 37 sessions.
2- Nifty tradeed 15 days within key supports range in last 37 sessions.
3- Three times up moves after getting support within key supports range in last 37 sessions.
4- Most Crucial Long Term Trend decider 200-Day SMA is just below this range at 5130

Conclusions from EOD chart analysis 

Correction is on and slipping below 5136 or 5130 can not be ruled out in ongoing correction but sustaining beyond key support range should be firstly watched for the confirmation of continuation/completion of on going correction.

Rally above 5236 after more consolidations

Nifty-Micro Analysis of 4 days Intra Day Chart
(Apr 24 to Apr 27,2012)

Nifty-Intra Day Chart (Apr 24 to Apr 27,2012):-
Just click on chart for its enlarged view
Technical Patterns and Formations in last 4 days intraday charts

1- More rhan 4 hours selling between 5208-5232 on 24-04-2012.
2- More rhan 2 hours selling between 5215-5236 on 25-04-2012.
3- Support between 5161-5195 on 25-04-2012.
4- Whole day sideways trading with intraday consolidation patterns between 5180-5210 on 26-04-2012.
5- Lower levels intraday support after whole day mixed intraday patterns

Conclusions from 4 days intra day chart analysis 

4 Days sideways narrow range trading within 81 points between 5155-5236 means big moves are being cooked between this range and blasting moves will be seen after its break out.

Firstly selling at higher levels but lower levels supports and consolidations also seen in last 4 days therefore it is clear that market is not prepared for any side decisive break out and some more preparations are also required for any side decisive break out.

Market is not mature for any side decisive break out therefore market will firstly trade and prepare for next moves within 5155-5236. As lower levels good supports seen therefore expected that finally strong rally above 5236 will be seen after some more consolidations in the coming sessions.

Lower levels support after higher levels slipping

Nifty-Micro Analysis of Intra Day Chart For 28-04-2012

Nifty-Intra Day Chart (27-Apr-2012):-
Just click on chart for its enlarged view
Technical Patterns and Formations in today intraday charts

1- Firstly more than 2 hours trading above 5200 between 5206-5221 with mixed intraday pattern
2- Down moves in falling Channel
3-  Almost last 3 hours trading between 5155-5183 with mixed intraday patterns and lower levels support.
4- Whole day trading between 5155-5222.

Conclusions from intra day chart analysis 

Flat closing with Doji Candle formation and lower levels support also within whole day mixed patterns are suggesting immaturity for any side decisive moves therefore more preparations are required for setting of trend.

As lower levels support also seen after higher levels slipping therefore rally possibility is alive  after some more consolidations.

Indian Stock Markets Closing Reports(27-Apr-2012)

Main features of today trading are as follows

1- Flat closing.
2- Doji Candle Formation.
3- Lower levels support after slipping from higher levels.

Ratios

Nifty Put Call Ratio: 1.02
Nifty P/E Ratio(27-Apr-2012): 17.93

Advances & Declines

BSE Advances : 1211
BSE Declines : 1592
NSE Advances :  551
NSE Declines :  884

Nifty Open Interest Changed Today

Nifty- 5100 CE(May)- +70950(+9.28%)
Nifty- 5100 PE(May)- +482550(+12.71%)

Nifty- 5200 CE(May)- +410300(+19.48%)
Nifty- 5200 PE(May)- +206300(+6.27%)

Nifty- 5300 CE(May)- +593400(+22.60%)
Nifty- 5300 PE(May)- +180300(+11.33%)

Closing 

Nifty- closed at 5,190.60(+1.60 Points & +0.03%)
Sensex- closed at 17,134.25(+3.58 Points & +0.02% )
CNX Midcap - closed at 7,368.60(-20.65 Points & -0.28%)
BSE Smallcap- closed at 6,697.89(-28.48 Points & -0.42%)

FII & DII trading activity in Capital Market Segment on 27-Apr-2012

FII trading activity on NSE and BSE in Capital Julket Segment(In Rs. Crores)
CategoryDateBuy ValueSell ValueNet Value
FII27-Apr-20122078.312454.53-376.22

DII trading activity on NSE and BSE in Capital Julket Segment(In Rs. Crores)
CategoryDateBuy ValueSell ValueNet Value
DII27-Apr-2012967.17824.61142.56

Nifty Spot-Levels & Trading Strategy for 28-04-2012

Nifty Spot-Levels

R3 5293
R2 5258
R1 5224
Avg 5189
S1 5155
S2 5120
S3 5086

Nifty Spot-Trading Strategy

H6 5259     Trgt 2
H5 5243     Trgt 1
H4 5227     Long breakout
H3 5208     Go Short
H2 5202
H1 5196
L1 5183
L2 5177
L3 5171    Long
L4 5152     Short Breakout
L5 5136     Trgt 1
L6 5120     Trgt 2

Nifty(May Fut)-Levels & Trading Strategy for 28-04-2012

Nifty(May Fut)-Levels

R3 5332
R2 5291
R1 5250
Avg 5209
S1 5168
S2 5127
S3 5086

Nifty(May Fut)-Trading Strategy

H6 5292     Trgt 2
H5 5273     Trgt 1
H4 5255     Long breakout
H3 5232     Go Short
H2 5225
H1 5217
L1 5202
L2 5194
L3 5187     Long
L4 5164     Short Breakout
L5 5146     Trgt 1
L6 5127    Trgt 2

Bank Nifty(May Fut)-Levels & Trading Strategy for 28-04-2012

Bank Nifty(May Fut)-Levels

R3 10488
R2 10379
R1 10261
Avg 10152
S1 10034
S2 9925
S3 9807

Bank Nifty(May Fut)-Trading Strategy

H6 10372     Trgt 2
H5 10320     Trgt 1
H4 10267     Long breakout
H3 10205     Go Short
H2 10184
H1 10163
L1 10122
L2 10101
L3 10080    Long
L4 10018    Short Breakout
L5  9965   Trgt 1
L6  9913    Trgt 2

Pre-Closing Outlook(27-04-2012)

Firstly more than 2 hours trading above 5200 between 5206-5221 with mixed intraday patterns,then slipping from higher levels and almost 3 hours trading between 5155-5183 again with mixed intraday patterns but lower levels support signals seen in last 3 hours also.

As per our view consolidation process is going on just click following topic link and understand technicals points/crucial levels of Indian markets:-

"Rally expectations developed after Intraday consolidations today"

Although negative zone trading but up moves possibilities are alive because lower levels supports seen today

Mid-session Outlook(27-04-2012)

Market could not sustain at higher levels and slipped after weakening of US Futures(Dow's Futures is 60 points down) and weak opening of European markets(most are more than 1% down)

As intraday consolidation therefore up moves were expected for today and it was seen also. Following lines were told yesterday in "Rally expectations developed after Intraday consolidations today":-

1- Follow up buying and base formations after more consolidations are required in the coming sessions and sustaining above following resistances will be rally commencement confirmation.

1- 5208-5236
2- 5288-5310

2- Whole day consolidation patterns between 5180-5197 today and sustaining it beyond will be firstly watched tomorrow

3-more consolidation is also required now therefore slipping possibility below 5180 can not be ruled out during consolidation process and following most crucial supports should be kept in mind:-

1- 5136(Next botom). 
2- 5130(200-Day SMA of today)
3- 5080(50% retracement level of previous rally)

Above lines are being repeated from yesterday posted outlook for the purpose of cautioning and understanding of technicals points and crucial levels of Indian markets..

Accuracy of our Outlooks proved by Today Up Moves

Post-open Outlook(27-04-2012)

SENSEX 112 points up and NIFTY 34 points up within first 15 minutes today but such up moves were projected yesterday in all the last 3 Outlooks and following lines were told:-

Consolidations Up moves possibility for today was projected yesterday in following words:-

1- In "Pre-Closing Outlook(26-04-2012)" at 3:17:00 PM: yesterday-

Whole day trading between 8180-5210 with consolidation indications.Today intraday consolidation patterns may be first step toward rally beginning 

2- In "Indian Stock Markets Closing Reports(26-Apr-2012)" at 07:47:00 PM yesterday

Sideways trading with intraday consolidation patterns despite negative closing today.

3- In "Rally expectations developed after Intraday consolidations today" at 10:41:00 PM yesterday

1- intraday patterns are showing consolidation formations therefore correction completion process beginning will be considered now.

2- Whole day consolidation patterns between 5180-5197 today and sustaining it beyond will be firstly watched tomorrow with expectations of up moves and rally.

Positive trading after Green opening today and only sustaining above 5197 should be firstly watched today because follow up buying is must for correction completion.

Rally expectations developed after Intraday consolidations today

Nifty-Micro Analysis of Intra Day Chart For 27-04-2012

Nifty-Intra Day Chart (26-Apr-2012):-
Just click on chart for its enlarged view
Technical Patterns and Formations in today intraday charts

1- Consolidation between 5180-5197 
2- Whole day sideways trading with intraday consolidation patterns
3- Whole day trading between 5180-5210

Conclusions from intra day chart analysis 

Although market closed near the lower levels and Black Candle formation today but intraday patterns are showing consolidation formations therefore correction completion process beginning will be considered now. Follow up buying and base formations after more consolidations are required in the coming sessions and sustaining above following resistances will be rally commencement confirmation.

1- 5208-5236
2- 5288-5310

As more consolidation is also required now therefore slipping possibility below 5180 can not be ruled out during consolidation process and following most crucial supports should be kept in mind:-

1- 5136(Next botom). 
2- 5130(200-Day SMA of today)
3- 5080(50% retracement level of previous rally)

Let consolidation process complete or more Bullish indications emerge then up moves and rally will be strongly projected. Expected that finally Nifty will not sustain below 5130 and will not slip below 5080 

All possibilities have been discussed above but Whole day consolidation patterns between 5180-5197 today and sustaining it beyond will be firstly watched tomorrow with expectations of up moves and rally. 

FII Trading Data in Derivatives Segment on 26-Apr-2012


FII & DII trading activity in Capital Market Segment on 26-Apr-2012


FII trading activity on NSE and BSE in Capital Julket Segment(In Rs. Crores)
CategoryDateBuy ValueSell ValueNet Value
FII26-Apr-20123356.743732.82-376.08

DII trading activity on NSE and BSE in Capital Julket Segment(In Rs. Crores)
CategoryDateBuy ValueSell ValueNet Value
DII26-Apr-20121491.421427.9363.49

Indian Stock Markets Closing Reports(26-Apr-2012)

Main features of today trading are as follows

1- Benchmark Indices closed in Red.
2- Black Candle formation.
3- Sideways trading with intraday consolidation patterns despite negative closing today.

Ratios

Nifty Put Call Ratio: 0.90
Nifty P/E Ratio(26-Apr-2012): 18.22

Advances & Declines

BSE Advances : 1127
BSE Declines : 1614
NSE Advances :  534
NSE Declines :  884

Nifty Open Interest Changed Today

Nifty- 5100 CE(May)- +156200(+22.36%)
Nifty- 5100 PE(May)- +897800(+31.11%)

Nifty- 5200 CE(May)- +354950(+19.87%)
Nifty- 5200 PE(May)- +427850(+14.90%)

Nifty- 5300 CE(May)- +473850(+21.86%)
Nifty- 5300 PE(May)- -81950(-4.91%)

Closing 

Nifty- closed at 5,189.00(-13.00 Points & -0.25%)
Sensex- closed at 17,130.67(-20.62 Points & -0.12% )
CNX Midcap - closed at 7,389.25(-41.00 Points & -0.55%)
BSE Smallcap- closed at 6,726.37(-27.50 Points & -0.41%)

Nifty Spot-Levels & Trading Strategy for 27-04-2012

Nifty Spot-Levels

R3 5245
R2 5230
R1 5209
Avg 5194
S1 5173
S2 5158
S3 5137

Nifty Spot-Trading Strategy

H6 5225     Trgt 2
H5 5216     Trgt 1
H4 5208     Long breakout
H3 5198     Go Short
H2 5195
H1 5192
L1 5185
L2 5182
L3 5179     Long
L4 5169     Short Breakout
L5 5161     Trgt 1
L6 5152     Trgt 2

Nifty(Apr Fut)-Levels & Trading Strategy for 27-04-2012

Nifty(Apr Fut)-Levels

R3 5278
R2 5262
R1 5238
Avg 5222
S1 5198
S2 5182
S3 5158

Nifty(Apr Fut)-Trading Strategy

H6 5254     Trgt 2
H5 5245     Trgt 1
H4 5236     Long breakout
H3 5225    Go Short
H2 5221
H1 5217
L1 5210
L2 5206
L3 5203     Long
L4 5192     Short Breakout
L5 5182     Trgt 1
L6 5173     Trgt 2

Bank Nifty(Apr Fut)-Levels & Trading Strategy for 27-04-2012

Bank Nifty(Apr Fut)-Levels

R3 10365
R2 10310
R1 10222
Avg 10167
S1 10079
S2 10024
S3 9936

Bank Nifty(Apr Fut)-Trading Strategy

H6 10277     Trgt 2
H5 10244    Trgt 1
H4 10212    Long breakout
H3 10173     Go Short
H2 10160
H1 10147
L1 10120
L2 10107
L3 10094    Long
L4 10055     Short Breakout
L5 10023     Trgt 1
L6  9990    Trgt 2

Pre-Closing Outlook(26-04-2012)

Whole day trading between 8180-5210 with consolidation indications. As good selling at higher levels therefore more consolidations and follow up buying as well as more confirmations are required. Today intraday consolidation patterns may be first step toward rally beginning therefore sustaining beyond above mentioned today trading should be firstly watched tomorrow for next moves confirmations.

Mid-session Outlook-2(26-04-2012)

Trading between 5185-5210 today and sustaining beyond this range will be 1st indication of next moves. Selling patterns seen at higher levels today but intraday support with nigher bottom also seen therefore sustaining beyond above mentioned  today trading range should be firstly watched next moves confirmations.

Mid-session Outlook(26-04-2012)

Quiet market on expiry day today because 7 hours selling between 5208-5236 in last 2 sessions and support between 5161-5195 on 25-04-2012 and both side moves are capped between 5161-5236.

As market is not prepared for any side decisive moves therefore sideways moves were expected for today and following lines were told in "Market at Most Crucial Support levels before Rally beginning"

Although Nifty recovered 50 points after lower levels support and Double Bottom formation on 25-04-2012 but not sufficient and complete consolidation with base formation is required for correction completion. As 7 hours selling between 5208-5236 in last 2 sessions and until Nifty will not sustain above 5236 till then any rally will not be considered.

3 Hours trading between 5185-5210 today and sustaining beyond this range will be 1st indication of next moves. As Selling patterns seen at higher levels today therefore down moves possibilities from here are turning high. Sustaining beyond 5161-5236 will be next trend strong confirmation.

Detailed analysis have already been updated in following topic.Just click following topic link and trade after understanding all crucial points and levels:-

Market at Most Crucial Support levels before Rally beginning

Market at Most Crucial Support levels before Rally beginning

Technical Analysis and Research For 26-04-2012

Nifty-Intra Day Chart (25-Apr-2012):-
Just click on chart for its enlarged view
Technical Patterns and Formations in today intraday charts

1- More than 7 hours selling between 5208-5236 in last 2 sessions.
2- Support between 5161-5195
3- Whole day trading between 5161-5236

Conclusions from Previous Topics

Although more than 50 points of Nifty fall was seen today just before 11:59 AM  on 13-04-2012  but we cautioned clearly before this fall and clearly told following lines:-

1- We told following line in "More Down moves possibility is still alive" at 12:18AM (mid night) on 25-04-2012:-

finally Nifty will not sustain above 5232 and more down moves possibility is still alive as well as slipping below 5200 is possible.

2- We told following line in "Post-open Outlook-2" at 11:18 AM on 25-04-2012 :-

Intraday selling patterns at higher levels today.

Lower Tops and Lower Bottoms Formation in EOD Chart:-

Following topic was posted on 13-04-2012. Just click following topic link and understand next moves possibility:-

Lower Tops and Lower Bottoms Formation In On Going Correction

Conclusion from above topic:-

As lower tops and lower bottoms formations in on going correction therefore new bottom B3 formations possibility below 5135.95 can not be ruled out in the coming sessions.

Next most crucial Supports:-

As correction is on therefore following 2 most crucial supports should also be kept in mind:-

1- Next support range 5136-5167(tested today)
2- Two times support at Long term Trend decider 200 Day SMA in on going correction and 200-Day SMA is today at 5132.

Importace of  Long term Trend decider 200 Day SMA:-

Importace of 200 Day SMA support has already been updated in following 2 topics. Just click following topic links and go through:-

1-  Posted on 15-04-2012- Last corrective Wave before Strong Bullish Rally 
2-  24-04-2012- Next Trend decider & Most Crucial 200-Day SMA 

Conclusion from above topics:-

Correction is on and its testing as well as slipping below it also can not be ruled out in the coming sessions but until Nifty will not sustain below Long term Trend decider 200-Day SMA till then Bullish market possibility will remain alive.

Bullish 'Flag Pattern' Formations:-

Correction continuation with Bullish 'Flag Pattern' Formation in EOD Chart therefore expected that finally strong rally will be seen after correction completion and in this regard following topic was posted on 08-04-2012. Just click following topic link and go through:-

 Bullish 'Flag Pattern' Formation in EOD Chart

Conclusions (After Putting All Studies Together)

Let market completely consolidate and form base then up moves will be considered otherwise more down moves will be seen. As correction is very nuch on and no cofirmation of its completion yet therefore its continuation can not be ruled out at this moment.

Volatile session  on 25-04-2012  because lower levels supports seen after higher levels selling and firstly trading will be seen within the highs and lows of last 2 sessions(5161-5239).

Although Nifty recovered 50 points after lower levels support and Double Bottom formation  on 25-04-2012 but not sufficient and complete consolidation with base formation is required for correction completion. As 7 hours selling between 5208-5236 in last 2 sessions and until Nifty will not sustain above 5236 till then any rally will not be considered.

Up moves confirmation will be minimum after sustaining above 1st Resistance(5236) and high possibility of support getting at or near about following most crucial support levels 

1- 5136
2- 5132(200-Day SMA)

Expected that strong rally will begin  after getting support near about above levels and 2 months correction completion. 

FII Trading Data in Derivatives Segment on 25-Apr-2012


FII & DII trading activity in Capital Market Segment on 25-Apr-2012

FII trading activity on NSE and BSE in Capital Julket Segment(In Rs. Crores)
CategoryDateBuy ValueSell ValueNet Value
FII25-Apr-20122176.642517.48-340.84

DII trading activity on NSE and BSE in Capital Julket Segment(In Rs. Crores)
CategoryDateBuy ValueSell ValueNet Value
DII25-Apr-2012911.18870.4840.7

Indian Stock Markets Closing Reports(25-Apr-2012)

Main features of today trading are as follows

1- Bullish Hammer Candle formation.
2- Benchmark Indices closed in Red.
3- Highly volatile market.

Ratios

Nifty Put Call Ratio: 1.03
Nifty P/E Ratio(25-Apr-2012): 18.27

Advances & Declines

BSE Advances : 1060
BSE Declines : 1676
NSE Advances :  453
NSE Declines :  979

Nifty Open Interest Changed Today

Nifty- 5100 CE(Apr)- +283500(+52.96%)
Nifty- 5100 PE(Apr)- +269700(+4.18%)

Nifty- 5200 CE(Apr)- -119950(-2.97%)
Nifty- 5200 PE(Apr)- -1276400(-19.19%)

Nifty- 5300 CE(Apr)- +272700(+4.61%)
Nifty- 5300 PE(Apr)- -358800(-12.13%)

Closing 

Nifty- closed at 5,202.00(-20.65 Points & -0.40%)
Sensex- closed at 17,151.29(-56.00 Points & -0.33% )
CNX Midcap - closed at 7,430.25(-59.85 Points & -0.80%)
BSE Smallcap- closed at 6,753.87(-35.94 Points & -0.53%)

Nifty Spot-Levels & Trading Strategy for 26-04-2012

Nifty Spot-Levels

R3 5314
R2 5275
R1 5238
PIVOT 5199
S1 5162
S2 5123
S3 5086

Nifty Spot-Trading Strategy

H6 5278     Trgt 2
H5 5261     Trgt 1
H4 5243     Long breakout
H3 5222    Go Short
H2 5215
H1 5208
L1 5195
L2 5188
L3 5181    Long
L4 5160     Short Breakout
L5 5142     Trgt 1
L6 5125     Trgt 2

Nifty(Apr Fut)-Levels & Trading Strategy for 26-04-2012

Nifty(Apr Fut)-Levels

R3 5319
R2 5277
R1 5237
PIVOT 5195
S1 5155
S2 5113
S3 5073

Nifty(Apr Fut)-Trading Strategy

H6 5280     Trgt 2
H5 5261     Trgt 1
H4 5243     Long breakout
H3 5220     Go Short
H2 5213
H1 5205
L1 5190
L2 5182
L3 5175     Long
L4 5152    Short Breakout
L5 5134     Trgt 1
L6 5115     Trgt 2

Bank Nifty(Apr Fut)-Levels & Trading Strategy for 26-04-2012

Bank Nifty(Apr Fut)-Levels

R3 10515
R2 10396
R1 10281
PIVOT 10162
S1 10047
S2 9928
S3 9813

Bank Nifty(Apr Fut)-Trading Strategy

H6 10403     Trgt 2
H5 10349     Trgt 1
H4 10295     Long breakout
H3 10231     Go Short
H2 10209
H1 10188
L1 10145
L2 10124
L3 10102     Long
L4 10038     Short Breakout
L5  9984     Trgt 1
L6  9930    Trgt 2

Pre-Closing Outlook(25-04-2012)

Only down moves were projected in all the Outlooks of this week and it was seen also in this week. Sharp fall today after more than 7 hours selling between 5208-5236 in last 2 sessions. Until Nifty will not sustain above 5236 till then any rally will not be considered.

Volatile session today because lower levels supports seen after higher levels selling and next few hours trading will be within the highs and lows of today and yesterday(5161-5239).

Correction is on and no cobfirmation of its completion yet. Let market completely consolidate and form base then up moves will be considered otherwise more down moves because correction is very much on and its continuation can not be ruled out.

Accuracy of our predictions

Following line was told in More Down moves possibility is still alive at 12:18AM (mid night) today;-

US markets are trading with good gains after European markets strong closing therefore intraday volatility and some up moves may be seen but expected that finally Nifty will not sustain above 5232 and more down moves possibility is still alive as well as slipping below 5200 is possible.

When Nifty was trading above 5215 then following line was told in Post-open Outlook-2 today:-

Intraday selling patterns at higher levels today.

Post-open Outlook-2(25-04-2012)

Intraday selling patterns at higher levels today.

Post-open Outlook(25-04-2012)

Range bound quiet market and sustaining beyond 5180-5241 will be next moves confirmations.

More Down moves possibility is still alive

Nifty-Micro Analysis of Intra Day Chart For 25-04-2012

Nifty-Intra Day Chart (24-Apr-2012):-
Just click on chart for its enlarged view
Technical Patterns and Formations in today intraday charts

1- More rhan 4 hours trading between 5208-5232 with selling indications
2- Whole day trading between 5181-5232

Conclusions from intra day chart analysis

Although Indian markets closed positive and today Candle is also Bullish Hammer but more rhan 4 hours trading with intraday selling indications today therefore down moves possibility is alive for tomorrow.

US markets are trading with good gains after European markets strong closing therefore intraday volatility and some up moves may be seen but expected that finally Nifty will not sustain above 5232 and more down moves possibility is still alive as well as slipping below 5200 is possible.

FII Trading Data in Derivatives Segment on 24-Apr-2012


FII & DII trading activity in Capital Market Segment on 24-Apr-2012

FII trading activity on NSE and BSE in Capital Julket Segment(In Rs. Crores)
CategoryDateBuy ValueSell ValueNet Value
FII24-Apr-20122158.433019.21-860.78

DII trading activity on NSE and BSE in Capital Julket Segment(In Rs. Crores)
CategoryDateBuy ValueSell ValueNet Value
DII24-Apr-20121462.541043.46419.08

Indian Stock Markets Closing Reports(24-Apr-2012)

Main features of today trading are as follows

1- Benckmark Indices closed in Green while Midcap and Smallcap posted Red closing.
2- Bullish Hammer Candle Formation.
3- Quiet market excet good gains in IT stockd and Indices.

Ratios

Nifty Put Call Ratio: 1.02
Nifty P/E Ratio(24-Apr-2012): 18.34

Advances & Declines

BSE Advances : 1304
BSE Declines : 1438
NSE Advances :  638
NSE Declines :  780

Nifty Open Interest Changed Today

Nifty- 5100 CE(Apr)- -19200(-3.320%)
Nifty- 5100 PE(Apr)- -337000(-4.97%)

Nifty- 5200 CE(Apr)- +305800(+7.78%)
Nifty- 5200 PE(Apr)- +1267300(+19.59%)

Nifty- 5300 CE(Apr)- +168450(+2.93%)
Nifty- 5300 PE(Apr)- -182250(-5.58%)

Closing 

Nifty- closed at 5,222.65(+22.05 Points & +0.42%)
Sensex- closed at 17,207.29(+110.61 Points & +0.65% )
CNX Midcap - closed at 7,490.10(-19.00 Points & -0.25%)
BSE Smallcap- closed at 6,789.81(-4.75 Points & -0.07%)

Nifty Spot-Levels & Trading Strategy for 25-04-2012

Nifty Spot-Levels

R3 5294
R2 5263
R1 5242
PIVOT 5211
S1 5190
S2 5159
S3 5138

Nifty Spot-Trading Strategy

H6 5274     Trgt 2
H5 5262     Trgt 1
H4 5250     Long breakout
H3 5236     Go Short
H2 5231
H1 5226
L1 5217
L2 5212
L3 5207     Long
L4 5193     Short Breakout
L5 5181     Trgt 1
L6 5169     Trgt 2

Nifty(Apr Fut)-Levels & Trading Strategy for 25-04-2012

Nifty(Apr Fut)-Levels

R3 5298
R2 5268
R1 5246
PIVOT 5216
S1 5194
S2 5164
S3 5142

Nifty(Apr Fut)-Trading Strategy

H6 5276     Trgt 2
H5 5264     Trgt 1
H4 5252     Long breakout
H3 5238     Go Short
H2 5233
H1 5228
L1 5219
L2 5214
L3 5209     Long
L4 5195     Short Breakout
L5 5183     Trgt 1
L6 5171     Trgt 2

Bank Nifty(Apr Fut)-Levels & Trading Strategy for 25-04-2012

Bank Nifty(Apr Fut)-Levels

R3 10561
R2 10465
R1 10354
PIVOT 10258
S1 10147
S2 10051
S3 9940

Bank Nifty(Apr Fut)-Trading Strategy

H6 10451     Trgt 2
H5 10404     Trgt 1
H4 10356     Long breakout
H3 10299     Go Short
H2 10280
H1 10261
L1 10224
L2 10205
L3 10186    Long
L4 10129     Short Breakout
L5 10081     Trgt 1
L6 10034     Trgt 2

Mid-session Outlook(24-04-2012)

Following possibility was clearly told today in Pull Back Rally,Intraday Volatilty & Correction continuation

Intraday indicatiors are oversold after yesterday sharp fall therefore Pull Back rally and intraday volatility is possible today.

Above mentioned moves are being seen today but correction is on and market require complete consolidation for trend reversal and let it happen then decisive up move will be considered.

Post-open Outlook-2(24-04-2012)

Market is preparing for next moves within range bound sideways market today. Firstly slipping after higher levels selling but intraday support also seen at lower levels.

Sustaining beyond following range will be firstly watched for next moves first indication:-

5182-5212

Post-open Outlook(24-04-2012)

Intraday selling seen above 5200 today

Pull Back Rally,Intraday Volatilty & Correction continuation

Nifty-Intra Day Chart (23-Apr-2012):-
Just click on chart for its enlarged view
Technical Patterns and Formations in today intraday charts

1- More than 2 hours selling between 5288-5310
2- Continuous down moves 
3- More down moves after minor up moves.
4- Whole day trading between 5188-5310

Conclusions from intra day chart analysis 

All the Benchmark Indices closed more than 1.50% down on 23-04-2012 and proved our following following projections 100% accurate:-

1- We told in Pre-Closing Outlook on 20-04-2012:-

"more down moves are expected now."

2- We told in Correction continuation & Supports Testing in Next Week at 05:45:00 AM on 23-04-2012;-

"more down moves are expected in the coming sessions"
"more down moves as well as testing of above mentioned next supports are possible in the coming week"

(1st support at 5184 was given in above outlook and lowest was at 5187.15 on 23-04-2012)

3- We told in Mid-session Outlook on 23-04-2012:-

"more down moves can not be ruled out"

Correction is very much on from 22-02-2012 and its detailed analysis and next possibilities have already been updated yesterday with EOD chart. Yesterday mentioned 1st support(5184) has almost been tested yesterday. As 2nd Support(5136) testing possibility can not been ruled out also and 200-Day SMA is lying today at 5137 therefore importance of this level has already been updated in following topic today. Just click following topic link and understand understand most crucial levels;-

Next Trend decider & Most Crucial 200-Day SMA 

Intraday indicatiors are oversold after yesterday sharp fall therefore Pull Back rally and intraday volatility is possible today. Market require complete consolidations and base formations before the beginning of any decisive up move and rally,let it happen then fresh up moves after correction completion will be considered.

Strong resistances above 5288 and next supports are between 5136 and 5184. Expected that next trend story will be written between 5136-5288 and volatile market with next moves preparation within this range will be seen in the coming sessions.

Next Trend decider & Most Crucial 200-Day SMA

Technical Analysis and Research For 24-04-2012

Nifty-EOD Chart (23-Apr-2012):-
Just click on chart for its enlarged view
Technical Patterns and Formations in EOD charts

1- Corrective wave begun on 05-11-2010 from 6338.
2- Long term correction confirmation after 200-Day SMA broken down.
3- Three times resistance at 200-Day SMA in correction.
4- 5th impulsive wave begun on 20-12-2011 from 4532.
5- Long term correction completion confirmation after 200-Day SMA broken out.
6- 5th wave gained 1098.80 Nifty Points in 45 sessions.
7- Correction of 5th Wave beginning on 22-02-2012 from 5629.
8- Two times support at 200-Day SMA in on going correction.

Conclusions from EOD chart analysis 

200-Day SMA proved Long term Trend decider and posed resistance in Bear market as well gave supports in Bull markets. Correction is on and yesterday mentioned 1st support(5184) has almost been tested yesterday as well as 2nd support(5136) testing possibility can not been ruled out also. As Long term trend decider 200-Day SMA is also lying today at 5137 therefore following levels have become most crucial;-

1- 5136
2- 5137

As 200-Day SMA is most crucial now therefore specially this topic has been posted to update its importance. Correction is very much on and its testing as well as slipping below it also can not be ruled out in the coming sessions but until Nifty will not sustain below 200-Day SMA till then Bullish market possibility will remain alive after correction completion.

Expected that finally Indian markets will remain Bullish without sustaining below 200-Day SMA.

FII Trading Data in Derivatives Segment on 23-Apr-2012


FII & DII trading activity in Capital Market Segment on 23-Apr-2012

FII trading activity on NSE and BSE in Capital Julket Segment(In Rs. Crores)
CategoryDateBuy ValueSell ValueNet Value
FII23-Apr-20121351.71759.19-407.49

DII trading activity on NSE and BSE in Capital Julket Segment(In Rs. Crores)
CategoryDateBuy ValueSell ValueNet Value
DII23-Apr-20121206.48754.78451.7

Indian Stock Markets Closing Reports(23-Apr-2012)

Main features of today trading are as follows

1- All the Indices closed in Red.
2- Black Candle.
3- Closing at the lowest of the day.

Ratios

Nifty Put Call Ratio: 1.11
Nifty P/E Ratio(23-Apr-2012): 18.26

Advances & Declines

BSE Advances :  964
BSE Declines : 1841
NSE Advances :  330
NSE Declines : 1116

Nifty Open Interest Changed Today

Nifty- 5000 CE(Apr)- -55900(-11.55%)
Nifty- 5000 PE(Apr)- +692950(+11.63%)

Nifty- 5100 CE(Apr)- +266400(+85.26%)
Nifty- 5100 PE(Apr)- +238700(+3.65%)

Nifty- 5200 CE(Apr)- +1619300(+70.08%)
Nifty- 5200 PE(Apr)- -490900(-7.05%)

Nifty- 5300 CE(Apr)- +1571300(+37.66%)
Nifty- 5300 PE(Apr)- -1003450(-23.49%)

Closing 

Nifty- closed at 5,200.60(-90.25 Points & -1.71%)
Sensex- closed at 17,096.68(-277.16 Points & -1.60% )
CNX Midcap - closed at 7,509.10(-117.30 Points & -1.54%)
BSE Smallcap- closed at 6,794.56(-106.02 Points & -1.54%)

Nifty Spot-Levels & Trading Strategy for 24-04-2012

Nifty Spot-Levels

R3 5400
R2 5355
R1 5277
Avg 5232
S1 5154
S2 5109
S3 5031

Nifty Spot-Trading Strategy

H6 5323     Trgt 2
H5 5295     Trgt 1
H4 5267     Long breakout
H3 5233    Go Short
H2 5222
H1 5211
L1 5188
L2 5177
L3 5166    Long
L4 5132    Short Breakout
L5 5104     Trgt 1
L6 5076    Trgt 2

Nifty(Apr Fut)-Levels & Trading Strategy for 24-04-2012

Nifty(Apr Fut)-Levels

R3 5412
R2 5363
R1 5280
Avg 5231
S1 5148
S2 5099
S3 5016

Nifty(Apr Fut)-Trading Strategy

H6 5330     Trgt 2
H5 5300     Trgt 1
H4 5270     Long breakout
H3 5234     Go Short
H2 5222
H1 5210
L1 5185
L2 5173
L3 5161     Long
L4 5125    Short Breakout
L5 5095     Trgt 1
L6 5065    Trgt 2

Bank Nifty(Apr Fut)-Levels & Trading Strategy for 24-04-2012

Bank Nifty(Apr Fut)-Levels

R3 10764
R2 10648
R1 10442
Avg 10326
S1 10120
S2 10004
S3  9798

Bank Nifty(Apr Fut)-Trading Strategy

H6 10559     Trgt 2
H5 10486     Trgt 1
H4 10414     Long breakout
H3 10325     Go Short
H2 10296
H1 10266
L1 10207
L2 10177
L3 10148     Long
L4 10059     Short Breakout
L5 9987     Trgt 1
L6 9914    Trgt 2

Live Proofs of our Accuracy

Following lines were told in Correction continuation & Supports Testing in Next Week at 05:45:00 AM today;-

more down moves as well as testing of above mentioned next supports are possible in the coming week.

Following 2 supports were also mentioned:-

4- 1st Support at 5184
5- 2nd Support at 5136

Above mentioned 1st support of 5184 has been almost tested today because today lowest is at 5187.15.

Pre-Closing Outlook(23-04-2012)

Our both previous outlooks are live proofs of this fact that We only told for down moves and correction continuations for today as well as cautioned also for minor up moves possibility only because people starts to buy at lower and cheaper rates.

Correction is on and following 2 supports with its testing possibility have already been updated in Correction continuation & Supports Testing in Next Week at 05:45:00 AM today;-

4- 1st Support at 5184
5- 2nd Support at 5136

Mid-session Outlook(23-04-2012)

Following lines were told in Correction continuation & Supports Testing in Next Week at 05:45:00 AM today;-

1- more down moves are expected in the coming sessions.
2- more down moves as well as testing of above mentioned next supports are possible in the coming week.

Nifty is more than 50 points down today and our above projection proved 100% accurate. Firstly selling at higher levels and then down moves seen today and more down moves can not be ruled out but intraday charts are oversold therefore minor up moves may be seen today after getting some intraday support.

Correction continuation & Supports Testing in Next Week

Technical Analysis,Research & Weekly Outlook
 (Apr 23 to Apr 27,2012)
Nifty-EOD Chart (20-Apr-2012):-
Just click on chart for its enlarged view
Technical Patterns and Formations in EOD charts

1- Bullish Flag Pattern(Falling Channel) in on going Correction
2- Bullish Flag Pattern(Falling Channel) Formations
3- Falling Channel false Break Out
4- 1st Support at 5184
5- 2nd Support at 5136

Conclusions from EOD chart analysis 

Falling Channel false Break Out was technically most crucial formation of previous week and firstly its impact will be seen in next week through more down moves

Nifty-Intra Day Chart (Apr 18 to Apr 20,2012):-
Just click on chart for its enlarged view
Technical Patterns and Formations in last 3 days intraday charts

1- Genuine selling between 5330-5341 on 18-04-2012.
2- Mixed Patterns(selling also) between 5325-5338 on 19-04-2012  
3- Almost 5 hours genuine selling between 5318-5336 on 20-04-2012

Nifty-Intra Day Chart (20-Apr-2012):-
Just click on chart for its enlarged view
Technical Patterns and Formations in intraday charts of 20-04-2012

1- Almost 5 hours genuine selling between 5318-5336
2- Sharp 70 points crash in 7 minutes.
3- Whole day trading between 5246-5336.

Conclusions from intra day charts analysis 

Although 70 Points crash after 02:20 PM but we clearly projected selling at 10:47:00 AM in Post-open Outlook(20-04-2012). Almost 5 hours genuine selling between 5318-5336 therefore market require complete consolidations for any move above 5336.

Sharp 70 points crash in 7 minutes on 20-04-2012 after 3 sessions selling and specially almost 5 hours genuine selling on 20-04-2012 therefore market requires complete consolidations for any move above 5336. Until complete consolidations will not happen minimum on intraday charts till then any rally above 5336 will not be considered.

As almost 5 hours huge selling is proved through genuine intraday selling patterns on 20-04-2012 therefore more down moves are expected in the coming sessions.

Conclusions (After Putting All Studies Together)

Corretion is on in Falling Channel and market crashed after forming 3rd lower top in last week therefore technical possibility of fresh bottom below 5136 should be kept in mind. In this regard following topic with EOD Chary was posted on 15-04-2012

Lower Tops and Lower Bottoms Formation In On Going Correction

(Just click above topic link and go through)

As third time resistance at falling trend line as well as 3 days intraday selling patterns near about it therefore sharp fall seen last Friday and more down moves as well as testing of above mentioned next supports are possible in the coming week.

correction completion confirmations will be after sustaining above 5341 and Nifty will firstly trade between 5175-5318 in the beginning of next week. Firstly sideways market within 5136-5341 and  sustaining it beyond will give next trend confirmations.

FII Trading Data in Derivatives Segment on 20-Apr-2012


FII & DII trading activity in Capital Market Segment on 20-Apr-2012

FII trading activity on NSE and BSE in Capital Julket Segment(In Rs. Crores)
CategoryDateBuy ValueSell ValueNet Value
FII20-Apr-20121729.831415.79314.04

DII trading activity on NSE and BSE in Capital Julket Segment(In Rs. Crores)
CategoryDateBuy ValueSell ValueNet Value
DII20-Apr-20121059.95925.21134.74

Indian Stock Markets Closing Reports(20-Apr-2012)

Main features of today trading are as follows

1- Black Candle.
2- Red closing.
3- Sharp down after almost 5 hours genuine selling.

Ratios

Nifty Put Call Ratio:1.10
Nifty P/E Ratio(20-Apr-2012): 18.58

Advances & Declines

BSE Advances : 1153
BSE Declines : 1655
NSE Advances :  505
NSE Declines :  952

Nifty Open Interest Changed Today

Nifty- 5100 CE(Apr)- -66300(-17.50%)
Nifty- 5100 PE(Apr)- +550450(+9.18%)

Nifty- 5200 CE(Apr)- -138650(-5.66%)
Nifty- 5200 PE(Apr)- -879450(-11.22%)

Nifty- 5300 CE(Apr)- -422500(-9.20%)
Nifty- 5300 PE(Apr)- -1160800(-21.37%)

Nifty- 5400 CE(Apr)- -376300(-5.38%)
Nifty- 5400 PE(Apr)- -592900(-20.35%)

Closing 

Nifty- closed at 5,290.85(-41.55 Points & -0.78%)
Sensex- closed at 17,373.84(-129.87 Points & -0.74% )
CNX Midcap - closed at 7,626.40(-71.25 Points & -0.93%)
BSE Smallcap- closed at 6,900.58(-32.25 Points & -0.47%)

Nifty Spot-Levels & Trading Strategy for 23-04-2012

Nifty Spot-Levels

R3 5427
R2 5381
R1 533
Avg 5290
S1 5245
S2 5199
S3 5154

Nifty Spot-Trading Strategy

H6 5382     Trgt 2
H5 5361     Trgt 1
H4 5341     Long breakout
H3 5316     Go Short
H2 5307
H1 5299
L1 5282
L2 5274
L3 5265     Long
L4 5240     Short Breakout
L5 5220     Trgt 1
L6 5199     Trgt 2

Nifty(Apr Fut)-Levels & Trading Strategy for 23-04-2012

Nifty(Apr Fut)-Levels

R3 5463
R2 5408
R1 5355
Avg 5300
S1 5247
S2 5192
S3 5139

Nifty(Apr Fut)-Trading Strategy

H6 5411     Trgt 2
H5 5386     Trgt 1
H4 5361     Long breakout
H3 5331     Go Short
H2 5321
H1 5311
L1 5292
L2 5282
L3 5272     Long
L4 5242     Short Breakout
L5 5217     Trgt 1
L6 5192    Trgt 2

Bank Nifty(Apr Fut)-Levels & Trading Strategy for 23-04-2012

Bank Nifty(Apr Fut)-Levels

R3 10814
R2 10712
R1 10589
Avg 10487
S1 10364
S2 10262
S3 10139

Bank Nifty(Apr Fut)-Trading Strategy

H6 10692     Trgt 2
H5 10641     Trgt 1
H4 10589     Long breakout
H3 10527     Go Short
H2 10507
H1 10486
L1 10445
L2 10424
L3 10404     Long
L4 10342     Short Breakout
L5 10290     Trgt 1
L6 10239     Trgt 2

Nifty Spot-Weekly Levels & Trading Strategy(Apr 23 to Apr 27,2012)

Nifty Spot-Weekly Levels

R3 5518
R2 5430
R1 5360
Avg 5272
S1 5202
S2 5114
S3 5044

Nifty Spot-Weekly Trading Strategy 

H6 5452     Trgt 2
H5 5415     Trgt 1
H4 5377     Long breakout
H3 5334     Go Short
H2 5319
H1 5305
L1 5276
L2 5262
L3 5247     Long
L4 5204     Short Breakout
L5 5166     Trgt 1
L6 5129     Trgt 2

Bank Nifty Spot-Weekly Levels & Trading Strategy(Apr 23 to Apr 27,2012)

Bank Nifty Spot-Weekly Levels

R3 11049
R2 10847
R1 10652
Avg 10450
S1 10255
S2 10053
S3 9858

Bank Nifty Spot-Weekly Trading Strategy 

H6 10862     Trgt 2
H5 10768     Trgt 1
H4 10675     Long breakout
H3 10566     Go Short
H2 10529
H1 10493
L1 10420
L2 10384
L3 10347     Long
L4 10238     Short Breakout
L5 10145     Trgt 1
L6 10051     Trgt 2