

Correction continuation but firstly up moves expectations & Watch levels in Interim Budget led volatile week
Technical Analysis,Research & Weekly Outlook
(Jan 29 to Feb 02,2024)
Nifty-EOD Chart Analysis
(Waves structure)
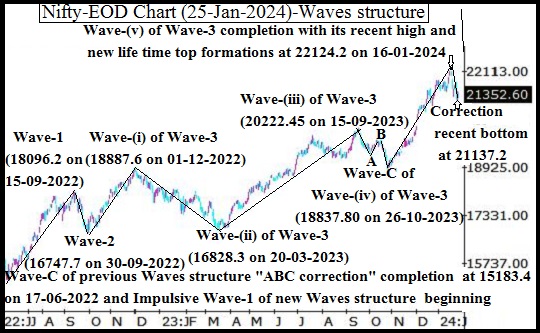
Nifty-EOD Chart (25-Jan-2024):-
Technical Patterns and Formations in EOD charts
1- Corrective Wave-C of previous Waves structure "ABC correction" completion at 15183.4 on 17-06-2022 and Impulsive Wave-1 of new Waves structure beginning.
2- Impulsive Wave-1 completion at 18096.2 on 15-09-2022.
3- Corrective Wave-2 completion at 16747.7 on 30-09-2022.
4- Impulsive Wave-(i) of Wave-3 completion at 18887.6 on 01-12-2022.
5- Corrective Wave-(ii) of Wave-3 completion at 16828.3 on 20-03-2023.
6- Impulsive Wave-(iii) of Wave-3 completion at 20222.45 on 15-09-2023 and Wave-A of "ABC" correction beginning.
7- Wave-A of Wave-(iv) of Wave-3 completion at 19333.6 on 04-10-2023.
8- Wave-B of Wave-(iv) of Wave-3 completion at 19849.8 on 17-10-2023.
9- Corrective Wave-C of Wave-(iv) of Wave-3 completion at 18837.80 on 26-10-2023 and impulsive Wave-(v) of Wave-3 beginning.
10- Impulsive Wave-(v) of Wave-3 completion with its recent high and new life time top formations at 22124.2 on 16-01-2024.
11- Short Term correction continuation with recent bottom formation at 21137.2 on 24-01-2024.
Conclusions from EOD chart analysis
(Waves structure)
Corrective Wave-C of "ABC correction" of previous Waves structure completion at 15183.4 on 17-06-2022 and from this level Impulsive Wave-1 of new Waves structure begun. Impulsive Wave-(v) of Wave-3 of this Waves structure completed with its recent high and new life time top formations at 22124.2 on 16-01-2024. Correction begun from life time top which is in continuation with its recent bottom formation at 21137.2 on 24-01-2024 and no confirmation of its completion yet on EOD and intraday charts.
Nifty-EOD Chart Analysis
(Stochastic & MACD)
Nifty-EOD Chart (25-Jan-2024):-

Technical Patterns and Formations in EOD charts
1- Stochastic- Both lines are kissing just above Over sold zone.
2- Stochastic:- %K(5)- 31.27 & %D(3)- 29.77.
3- In MACD- MACD line has intersected Average line downward and its both lines are falling in negative and positive zone.
4- MACD(26,12)- -19.27 & EXP(9)- 108.21 & Divergence- -127.48
Conclusions from EOD chart analysis
(Stochastic & MACD)
Position of Short Term indicators are as follows:-
1- As in Stochastic indicator its both lines are kissing just above Over sold zone therefore showing first signal of Short term up moves beginning
2- As in MACD indicator MACD line has intersected Average line downward and its both lines are falling in negative and positive zone therefore it will be understood that this indicator is confirming Short Term Trend turning downward and on going correction continuation possibility also.
Nifty-EOD Chart Analysis
(Averages)
Nifty-EOD Chart (25-Jan-2024):-

Technical Patterns and Formations in EOD charts
Averages:-
1- 5-Day SMA is today at 21447
2- 21-Day SMA is today at 21639
3- 55-Day SMA is today at 20902
4- 100-Day SMA is today at 20311
5- 200-Day SMA is today at 19573
Conclusions from EOD chart analysis
(Averages)
As Nifty is closing below Short Term Trend decider 5 and 21-Day SMA for the last 7 sessions therefore Short Term Trend is confirmed downward. Intermediate Term Trend decider 55-Day SMA is today at 20902 which is little above recent bottom of Nifty(21137.20) and Sustaining it beyond should be firstly watched in the coming week/weeks for Intermediate Term Trend formation confirmations because once its downward confirmations will mean more Down moves for the next 3 weeks to 3 months. Now Nifty is well above Long Term Trend decider 200-Day SMA therefore at present Long Term Trend is up,
Nifty-Intra Day Chart Analysis
(25-Jan-2024)
Nifty-Intra Day Chart (25-Jan-2024):-

Technical Patterns formation in today intraday charts
1- 211 Points fall in first 2 hours after flat opening.
2- Consolidation between 21248-21311
3- 134 Points sharp up moves in last half hour.
4- Whole day actual trading between 21248-21459
Conclusions from intra day chart analysis
Although flat opening but firstly 211 points fall was seen in first 2 hours last Thursday. As lower levels more than 3 hours consolidation therefore sharp up moves developed in last half hour. Expected that last Thursday started up moves will remain continued in the beginning of next week above day's Highest(21459).
Conclusions
(After putting all studies together)
1- Long Term trend is up.
2- Intermediate Term trend is up.
3- Short Term Trend down.
Impulsive Wave-(v) of Wave-3 completed after life time top formations at 22124.2 on 16-01-2024 and Short Term correction begun from this level which is in continuation with recent bottom formation at 21137.2 on 24-01-2024 and no confirmation of its completion yet.
Although MACD indicator is confirming Downward Trend formations but Stochastic indicator is signalling up moves beginning possibility. As intraday charts of last Thursday are showing lower levels good intraday consolidation therefore up moves will be seen in the beginning of next week towards following next resistances:-
1- 21535-21562
2- 21631-21689
3- 21852-21969(Gap Resistance)
4- 22034-22055
5- 22079-22124
Interim Budget-2024 will be tabled in the Parliament on 01-02-2024 and Indian Stock markets are in correction mode therefore Nifty will be highly volatile hence following supports should also be watched in next week for the life and length of on going correction:-
1- 21248-21311
2- 21193-21263
3- 21078-21154
4- 20770-20852
Although correction continuation but firstly up moves is expected in the coming week. As Interim Budget led volatilitily will also be seen in next week therefore above mentioned supports and resistances should also be watched for next immediate moves beginning confirmations.

