As not feeling well therefore Stock Market Outlook of today(20-11-2020) is not being updated.

ॐ ह्रीं श्रीं लक्ष्मीभयो नमः॥

Levels will confirm next
Short Term Trend
Nifty-Intra Day Chart Analysis &
Market Outlook(19-11-2020)
Nifty-Intra Day Chart (18-Nov-2020):-

Technical Patterns formation in today intraday charts
1- Consolidation between 12820-12887(immediate supports)
2- Slow up moves in last 2 hours
3- Whole day actual trading between 12820-12948
Conclusions from intra day chart analysis
As selling was seen between 12842-12865 yesterday therefore firstly Nifty consolidated within and near about this range today and after that up moves were seen.
Although today closing was at the top of the day and rally as well but some selling can not be ruled out in last 2 hours slow up moves amid heated sentiments therefore until Nifty will not sustain above today(12948) after fresh consolidation till then next immediate up moves will not be seen.
Expected that Nifty will firstly trade and prepare for next Short Term Trend within and near about 12798-12948 and finally sustaining it beyond will confirm it hence should be firstly watched in the next 1/2 sessions.
Follow up consolidation is firstly required for next rally above 13000
Nifty-Intra Day Chart Analysis &
Market Outlook(18-11-2020)
Nifty-Intra Day Chart (17-Nov-2020):-
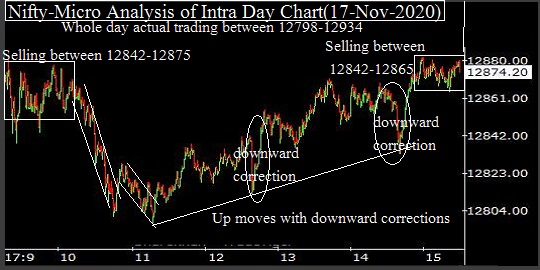
Technical Patterns formation in today intraday charts
1- Selling between 12842-12875
2- Down moves in Bullish Falling Channel
3- Up moves with downward corrections
4- Selling between 12842-12865
5- Whole day actual trading between 12798-12934
Conclusions from intra day chart analysis
As Dow Jones closed 470 points up yesterday therefore strong opening of Indian markets but sentiments turned heated hence some selling developed and down moves were seen.
Consolidation was also seen firstly through Down moves in Bullish Falling Channels and after that Up moves with downward corrections therefore today closing was near the higher levels of the day.
As selling was also seen in last half hour hence follow up consolidation is firstly required near about today highest tomorrow for next rally above 13000 because overbought Short Term Indicators are suggesting Short Term correction is on cards.
Watch levels for confirmations amid Short Term correction possibility
Nifty-Intra Day Charts Analysis &
Market Outlook(17-11-2020)
Nifty-Intra Day Chart (Nov 11 to Nov 14,2020):-

Technical Patterns formation in last 4 Sessions intraday charts
1- Consolidation between 12572-12644 on 11-11-2020
2- Selling between 12709-12769 on 11-11-2020
3- Sideways trading between 12660-12727 on 12 & 13-11-2020
4- Consolidation between 12611-12640 on 13-11-2020
5- Sideways in last 3 sessions between 12572-12769 before Diwali Muhurt session
6- Selling between 12790-12828 on 14-11-2020
7- 4 Sessions actual trading between 12572-12828
Conclusions from 4 Sessions intra day chart analysis
All trends are up and Bullish rally is very much on but Short Term Indicator Stochastic is overbought and indicating emergence of Short Term correction possibility.
Although strong gap up opening on Diwali Muhurt session but not sustaining at higher levels and closing was near the lower levels after selling between 12790-12828 therefore it will be immediate resistance of Nifty.
Nifty remained sideways in last 3 sessions between 12572-12769 before Diwali Muhurt sessions with lower levels supports and higher levels selling as well as Sideways trading between 12660-12727 therefore following levels should be firstly watched in next week for:-
1- 12660-12727 for first indication of next decisive moves beginning.
2- 12572-12769 break down will confirm Short Term correction below 12572 and break out will confirm fresh rally above 12828.
Watch above levels for confirmations amid Short Term correction possibility in next week.
Subscribe to:
Posts (Atom)