

Nifty-EOD Chart(13-Jan-2011):-
Technical Patterns and Formations in EOD charts
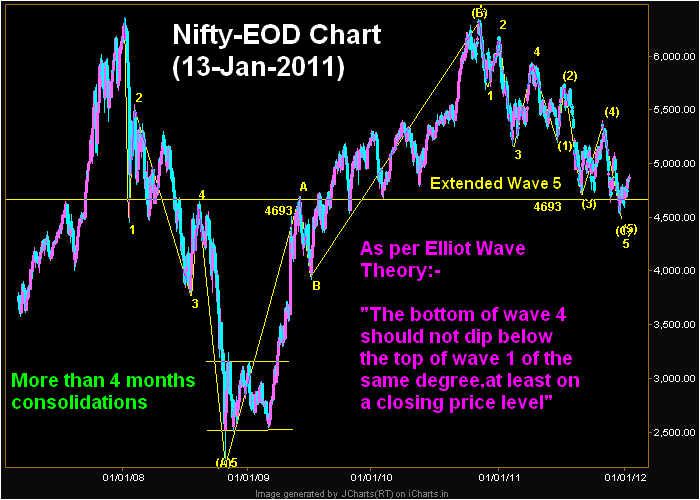
1- 5 Waves OF Wave A correction completed in 2008
2- 'ABC' up moves of Wave B
3- 5th Wave of Wave c is extended
4- 5th Wave of Wave c completion signals at 4531.15 on 20-12-2011
Conclusions from EOD chart analysis
As per Elliot Wave Theory:-
"The bottom of wave 4 should not dip below the top of wave 1 of the same degree,at least on a closing price level"
Top of wave 1 was at 4693 and Nifty closed below it 5 days therefore wave 1 validity is doubtful therefore recalculation of waves on long charts is required. It has been concluded that correction of 11 years rally begun in Jan 2008 and Corrective Wave 'C' is on at present.
Short term up moves commenced within it from 21-12-2011 but Wave 'C' termination confirmation is required yet. Indian markets remained sideways for 10 years(1992-2001) and after that more than 6 years rally was seen therefore market will take its own time in consolidation and after that fresh strong rally will be seen to form new highs.
Latest bottom is at 4531.15 and if Nifty sustains above it then Fresh rally wil be considered after crossing of crucial resistances and up trend deciding levels.
Nifty-EOD Chart(13-Jan-2011):-
As following developments therefore hopes of fresh rally are alive from 4531.15:-
1- 13 is a Fibonacci number and on going up move started in Dec 2011 which is 13th month of Wave 'C' correction.
2- Trend Reversal Broadening Pattern at the bottom of 13 months correction is still intact
3- 109 Sessions sideways market between 4720-5229 and its break out will mean beginning of strong moves..
 |
| Just click on chart for its enlarged view |
1- 5 Waves OF Wave A correction completed in 2008
2- 'ABC' up moves of Wave B
3- 5th Wave of Wave c is extended
4- 5th Wave of Wave c completion signals at 4531.15 on 20-12-2011
Conclusions from EOD chart analysis
As per Elliot Wave Theory:-
"The bottom of wave 4 should not dip below the top of wave 1 of the same degree,at least on a closing price level"
Top of wave 1 was at 4693 and Nifty closed below it 5 days therefore wave 1 validity is doubtful therefore recalculation of waves on long charts is required. It has been concluded that correction of 11 years rally begun in Jan 2008 and Corrective Wave 'C' is on at present.
Short term up moves commenced within it from 21-12-2011 but Wave 'C' termination confirmation is required yet. Indian markets remained sideways for 10 years(1992-2001) and after that more than 6 years rally was seen therefore market will take its own time in consolidation and after that fresh strong rally will be seen to form new highs.
Latest bottom is at 4531.15 and if Nifty sustains above it then Fresh rally wil be considered after crossing of crucial resistances and up trend deciding levels.
Nifty-EOD Chart(13-Jan-2011):-
 |
| Just click on chart for its enlarged view |
1- 13 is a Fibonacci number and on going up move started in Dec 2011 which is 13th month of Wave 'C' correction.
2- Trend Reversal Broadening Pattern at the bottom of 13 months correction is still intact
3- 109 Sessions sideways market between 4720-5229 and its break out will mean beginning of strong moves..