

Nifty-Micro Analysis of Intra Day Chart For 11-01-2012
Nifty-Intra Day Chart(10-Jan-2011):-
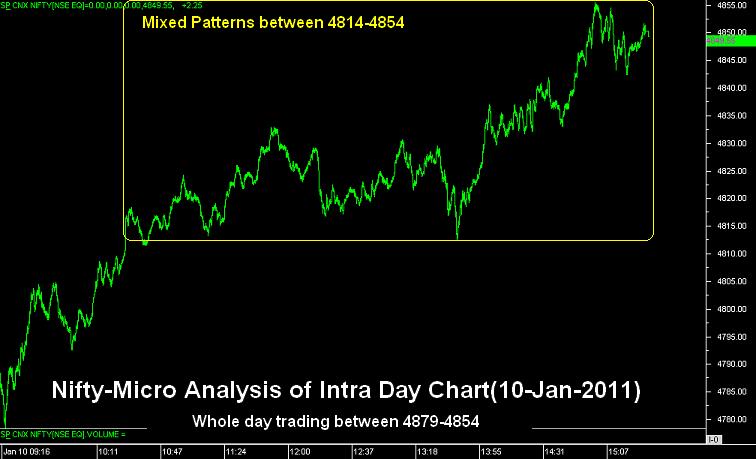
Technical Patterns and Formations in today intraday charts
1- Whole day up moves.
2- Mixed Patterns between 4814-4854
3- Whole day trading between 4879-4854
Conclusions from intra day chart analysis
Long term and intermediate term trends are down while short term trend gave upward confirmation yesterday. Intermediate term trend will be up after sustaining above 5100. Long term trend and revival of bull markets hopes will be after sustaining above 200 Day EMA(today at 5148). As 200 Day SMA(today at 5251) has posed resistance 3 times earlier therefore sustaining above will be confirmation of up trend strength.
Expected that rally will remain continued but consolidation is required before each up move because multiple resistances at higher levels.As mixed intraday patterns during 5 hours of trading on 10-01-2012 therefore consolidation is required and that may be seen between yesterday mixed pattrens trading range also.
Opening will depend on global cues but expected that rally will remain continued in Indian markets and next up moves are expected within couple of sessions.
Although strong upmoves were seen on 10-Jan-2011 but it was projected more than 10 times in previous outlooks. For supports,resistances and detailed analysis just click following weekly analysis link which was updated on 07-1-2012
Nifty-Intra Day Chart(10-Jan-2011):-
 |
| Just click on chart for its enlarged view |
1- Whole day up moves.
2- Mixed Patterns between 4814-4854
3- Whole day trading between 4879-4854
Conclusions from intra day chart analysis
Long term and intermediate term trends are down while short term trend gave upward confirmation yesterday. Intermediate term trend will be up after sustaining above 5100. Long term trend and revival of bull markets hopes will be after sustaining above 200 Day EMA(today at 5148). As 200 Day SMA(today at 5251) has posed resistance 3 times earlier therefore sustaining above will be confirmation of up trend strength.
Expected that rally will remain continued but consolidation is required before each up move because multiple resistances at higher levels.As mixed intraday patterns during 5 hours of trading on 10-01-2012 therefore consolidation is required and that may be seen between yesterday mixed pattrens trading range also.
Opening will depend on global cues but expected that rally will remain continued in Indian markets and next up moves are expected within couple of sessions.
Although strong upmoves were seen on 10-Jan-2011 but it was projected more than 10 times in previous outlooks. For supports,resistances and detailed analysis just click following weekly analysis link which was updated on 07-1-2012