ॐ ह्रीं श्रीं लक्ष्मीभयो नमः॥


Trading "calls" from our "Software" with more than "90% accuracy"

More than "12 years" old "only site of whole world" 
with more than "9700 accurate Outlooks" of 
"Indian Stock Markets" 

Daily Indicators and Averages Analysis

Daily Indicators and Averages Analysis Chart:-
Just click on chart for its enlarged view
Conclusions

1- Averages(EMA-8,21,55,200)- Nifty moved and closed(5476) above 8 day EMA(5435) but below 21 day EMA(5506) and short term top is at 5518 therefore short term trend is still down.55 day EMA is at 5587 and 200 day EMA is at 5606 and intermediate term top is at 5605 therefore intermediate and long term trends will be up above 5606.

2- Bollinger Band- Nifty started up moves after getting support above lower band and resting below Mid Line(5502). As lower levels good support therefore testing of Mid Line and Upper Band is possible.

3- MACD- Both lines are kissing above over sold zone. Average line is flat while MACD line is moving up. Upward intersection of Average line will be upmoves confirmation and it is expected also.

4- ROC- Positive divergence in oversold area and moving up but below equalibrium line. Although upmoves confirmation will be moving above equalibrium line but expected that Nifty will move above it and will give upmoves confirmations.

5- RSI- Positive divergence in oversold area and moving up but below equalibrium line. Although upmoves confirmation will be moving above equalibrium line but expected that Nifty will move above it and will give upmoves confirmations.

6- Slow Stochastic- Very short term indicator and remained almost 1 month in oversold zone and moved above it in previous week. As passed sufficient time in oversold zone and now moved above therefore expected that overbought area will be tested by this fast moving very short term oscillator.

7- William %R- Very short term indicator and remained almost 1 month in oversold zone and moved above it in previous week. As passed sufficient time in oversold zone and now moved above therefore expected that overbought area will be tested by this fast moving very short term oscillator.

Recent Topics,Technical Analysis,News & Research For 30-05-2011 Trading

13 Topics have been posted for 30-05-2011 trading and more topics will be posted today and tomorrow.Just click at following topics names and go through as well as analyse Chart:-

Topics prepared by Enjoy Daily Profits

2- Nifty-Micro Analysis of Intra Day Chart for 30-05-2011 trading
3- Nifty Spot-Levels & Trading Strategy for 30-05-2011
4- Nifty(Jun Fut)-Levels & Trading Strategy for 30-05-2011
When Whole India & Business TV Channels

     were Bearish and telling for 5200 then  

        Bullish Market and Pull Back Rally 

           was non stop,again and again 

        Predicted only in this Blog

          Only We Told Rally In 
          Indian Stock Markets
          

Nifty Spot-Levels & Trading Strategy for 30-05-2011

Nifty Spot-Levels

R3 5575.00
R2 5530.00
R1 5503.00
Avg 5458.00
S1 5431.00
S2 5386.00
S3 5359.00

Nifty Spot-Trading Strategy

H6  5548    Trgt 2
H5  5532    Trgt 1
H4  5515    Long breakout
H3  5495    Go Short
H2  5489
H1  5482
L1  5469
L2  5462
L3  5456    Long
L4  5436    Short Breakout
L5  5419    Trgt 1
L6  5403    Trgt 2

Nifty(Jun Fut)-Levels & Trading Strategy for 30-05-2011

Nifty(Jun Fut)-Levels

R3 5560
R2 5521
R1 5493
Avg 5454
S1 5426
S2 5387
S3 5359

Nifty(Jun Fut)-Trading Strategy

H6 5533     Trgt 2
H5 5518     Trgt 1
H4 5502     Long breakout
H3 5484     Go Short
H2 5478
H1 5472
L1 5459
L2 5453
L3 5447     Long
L4 5429     Short Breakout
L5 5413     Trgt 1
L6 5398     Trgt 2

Bank Nifty(Jun Fut)-Levels & Trading Strategy for 30-05-2011

Bank Nifty(Jun Fut)-Levels

R3 10945
R2 10802
R1 10720
Avg 10577
S1 10495
S2 10352
S3 10270

Bank Nifty(Jun Fut)-Trading Strategy

H6 10867     Trgt 2
H5 10814     Trgt 1
H4 10761     Long breakout
H3 10699     Go Short
H2 10679
H1 10658
L1 10617
L2 10596
L3 10576    Long
L4 10514     Short Breakout
L5 10461     Trgt 1
L6 10408     Trgt 2

Nifty Spot-Weekly Levels & Trading Strategy(May 30 to Jun 03,2011)

Nifty Spot-Weekly Levels

R3 5688
R2 5587
R1 5531
Avg 5430
S1 5374
S2 5273
S3 5217

Nifty Spot-Weekly Trading Strategy 

H6 5637     Trgt 2
H5 5599     Trgt 1
H4 5562     Long breakout
H3 5519     Go Short
H2 5504
H1 5490
L1 5461
L2 5447
L3 5432     Long
L4 5389     Short Breakout
L5 5352     Trgt 1
L6 5314     Trgt 2

Nifty-Micro Analysis of Intra Day Chart for 30-05-2011 trading

Nifty-Intra Day Chart(27-05-2011):-
Just click on chart for its enlarged view
Main Features

1- 2 Times some distribution at higher levels.
2- 2 Times consolidations at lower levels also.
3- Conclusion is Consolidations both times

Conclusions


Although two times minor distributions at higher levels but consolidations at lower levels also. Final conclusion is consolidation and expected that previous week started rally will remain continued in the coming week.

Indian Stock Markets Closing Reports(27-05-2011)

Main features of today trading are as follows

1- White Candle.
2- All the Indices closed in Green except CD and AUTO
3- Whole day consolidations except minor selling indications in last 3 hours.

Ratios

Nifty Put Call Ratio: 1.00
Nifty P/E Ratio(27-05-2011): 20.26

Advances & Declines

BSE ADVANCES : 1729
BSE DECLINES : 1076
NSE ADVANCES : 973
NSE DECLINES : 434

Nifty Open Interest Changed Today

Nifty- 5300 CE(Jun)- +29900(+1.76%)
Nifty- 5300 PE(Jun)- +872450(+17.65%)

Nifty- 5400 CE(Jun)-64350(-2.08%)
Nifty- 5400 PE(Jun)- +1355850(+33.29%)

Nifty- 5500 CE(Jun)- +533100(+19.29%)
Nifty- 5500 PE(Jun)- +518150(+21.37%)

Nifty- 5600 CE(Jun)- +1028400(+31.54%)
Nifty- 5600 PE(Jun)- +70100(+5.28%)

Closing

Nifty- closed at 5,476.10(+63.75 Points & +1.18%)
Sensex- closed at 18,266.10(+221.46 Points & +1.23%)
CNX MIDCAP - closed at 7,875.35(+124.70 Points & +1.61%)
BSE SMALL CAP- closed at 8,109.86(+71.68 Points & +0.89%)

FII Trading Data in Derivatives Segment on 27-May-2011


FII & DII trading activity in Capital Market Segment on 27-May-2011

FII trading activity on NSE and BSE in Capital Mayket Segment(In Rs. Crores)
CategoryDateBuy ValueSell ValueNet Value
FII27-May-20112719.762497.73222.03


DII trading activity on NSE and BSE in Capital Mayket Segment(In Rs. Crores)
CategoryDateBuy ValueSell ValueNet Value
DII27-May-20111076.64688.39388.25

Pre-closing Outlook(27-05-2011)

Very short term moves were expected above 5465 and it was seen also and Nifty traded last 3 hours between 5465-5485. Rally above 5444 was also projected and Nifty traded almost whole day today above 5444. Selling seen between 5475-5485 otherwise whole day intra day patterns are suggesting consolidations.

Mid-session Outlook(27-05-2011)


 Some profit booking signals emerged between 5450-5461 but shorting is not advised because bullish markets consolidated at higher levels and surges sharply without giving short covering opportunity.

Nifty is sustaining above 5444 today and go long above 5465. Shorting should be considered below 5444.

5444-5465 are next very short term moves confirmation levels.

Mid-session Outlook(27-05-2011)


Some profit booking in last 1 hour between 5450-5461

Post-open Outlook(27-05-2011)

Market showed strength,Nifty crossed 5444 in first minute and trading above mentioned resistance range(5422-5444). Strong rally started yesterday but it was non stop predicted is more than 7 outlooks in last 3 days. It is strong Indian markets indication that Nifty is trading above 5444 and between upper band of mentioned resistance range. It is the character of Bullish markets that it consolidate at higher levels.

Indications of strong rally begining and sustaining above 5444 will mean testing possibility of following next resistance ranges:-

1- 5490-5512
2- 5588-5605

Pre-open Outlook(27-05-2011)

US markets closed positive yesterday and most Asian markets are responding it with Green zone trading therefore sentiment is positive today morning. Expected that Nifty will first trade between 5390-5430 after Green opening. As next resistance(5422-5444) is strong therefore more consolidation is required for next rally.

No indication of down moves yesterday and rally also expected and expected that Nifty will consolidate below or near about mentioned resistance range in the coming sessions and after that rally will be seen in the coming week. Expected that Nifty will firstly hover around 5400 and after some more consolidations 5444 will be crossed in the coming week. Next resistance range(5422-5444) crossing will mean strong rally..

Strong Rally above 5444


Market Outlook(27-05-2011)

Just click follwing Links of EOD and intraday chart analysis to understand today market;-

1- Nifty-Micro Analysis of Intra Day Chart For 27-05-2011
2- Technical Analysis of EOD Chart and Research

Conclusions

Moderate gains yesterday after good consolidations between 5330-5355 and bullish reversal patterns in previous sessions. As emergence of Bullish trend reversal pattern therefore rally and upmoves expectations are alive now but strong resistances at higher levels and minimum one resistance crossing will be confirmation of rally.

Following levels were given yesterday and Nifty honoured them completely:-

Following line was told in Mid-session Outlook at 11:05:00 AM Yesterday:-

"Today intra day charts are showing consolidations and move above 5422 will be strong rally confirmation"

Yesterday highest was at 5422.20 and Nifty could not moved above it.

Following line was told in Mid-session Outlook-2 at 02:04:00 PM Yesterday:-

"Next moves preparation range is 5350-5395"

Steep fall was seen after my above statement but Nifty could not dipped below 5350 and sharply surged from 5354

No indication of down moves yesterday and rally also expected but next resistance is between 5422-5444 and expected that Nifty will consolidate below or near about this range in the coming sessions and after that rally will be seen in the coming week. Expected that Nifty will firstly hover around 5400 and after some more consolidations 5444 will be crossed in the coming week. Next resistance range(5422-5444) crossing will mean strong rally. 

Nifty-Micro Analysis of Intra Day Chart For 27-05-2011

Nifty-Intra Day Chart(26-05-2011):-
Just click on chart for its enlarged view
Main Features

1- Positive opening
2- Consolidations between 5355-5382
3- Mixed Patterns between 5372-6406
4- Voltality

Conclusions

Volitile day with consolidations at lower levels,steep fall after some profit booking and sharp surge after some more consolidations. As huge intraday volatile day therefore more intraday patterns are required for next moves confirmations.

Sharp surge seen in last half hour therefore it is strong indication of positive market but crossing of next resistance(5222-5444) is must for a sustained rally confirmation

FII Trading Data in Derivatives Segment on 26-May-2011


FII & DII trading activity in Capital Market Segment on 26-May-2011

FII trading activity on NSE and BSE in Capital Mayket Segment(In Rs. Crores)
CategoryDateBuy ValueSell ValueNet Value
FII26-May-20113743.643619.26124.38


DII trading activity on NSE and BSE in Capital Mayket Segment(In Rs. Crores)
CategoryDateBuy ValueSell ValueNet Value
DII26-May-20111696.011462.48233.53

Indian Stock Markets Closing Reports(26-05-2011)

Main features of today trading are as follows:-

1- White Candle
2- All the Indices closed positive except IT and FMCG
3- Intraday patterns are showing consolidations.


Ratios

Nifty Put Call Ratio: 0.95
Nifty P/E Ratio(26-05-2011): 19.95

Advances & Declines

BSE ADVANCES : 1471
BSE DECLINES : 1303
NSE ADVANCES :  747
NSE DECLINES :  630

Nifty Open Interest Changed Today:


Nifty- 5300 CE(26-05-2011)- +106100(+6.61%)
Nifty- 5300 PE(26-05-2011)- +1289000(+34.14%)

Nifty- 5400 CE(26-05-2011)- +376950(+13.83%)
Nifty- 5400 PE(26-05-2011)- +843650(+26.27%)

Nifty- 5500 CE(26-05-2011)- +156950(+6.12%)
Nifty- 5500 PE(26-05-2011)- +112250(+4.86%)

Closing

Nifty- closed at 5,412.35(+63.40 Points & +1.19%)
Sensex- closed at 18,044.64(+197.40 Points & +1.11% )
CNX MIDCAP - closed at 7,750.65(-9.35 Points & -0.12%%)
BSE SMALL CAP- closed at 8,038.18(+36.46 Points & +0.46%)

Nifty Spot-Levels & Trading Strategy for 27-05-2011

Nifty Spot-Levels

R3 5503.33
R2 5462.67
R1 5437.33
Avg 5396.67
S1 5371.33
S2 5330.67
S3 5305.33

Nifty Spot-Trading Strategy

H6  5478    Trgt 2
H5  5463    Trgt 1
H4  5448   Long breakout
H3  5430    Go Short
H2  5424
H1  5418
L1  5405
L2  5399
L3  5393    Long
L4  5375    Short Breakout
L5  5360    Trgt 1
L6  5345    Trgt 2

Nifty(JUN Fut)-Levels & Trading Strategy for 27-05-2011

Nifty(JUN Fut)-Levels

R3 5474.67
R2 5441.33
R1 5415.67
Avg 5382.33
S1 5356.67
S2 5323.33
S3 5297.67

Nifty(JUN Fut)-Trading Strategy

H6  5449    Trgt 2
H5  5435    Trgt 1
H4  5422    Long breakout
H3  5406    Go Short
H2  5400
H1  5395
L1  5384
L2  5379
L3  5373    Long
L4  5357    Short Breakout
L5  5344    Trgt 1
L6  5330    Trgt 2

Bank Nifty(JUN Fut)-Levels & Trading Strategy for 27-05-2011

Bank Nifty(JUN Fut)-Levels

R3 10594.00
R2 10523.00
R1 10453.00
Avg 10382.00
S1 10312.00
S2 10241.00
S3 10171.00

Bank Nifty(JUN Fut)-Trading Strategy

H6  10524   Trgt 2
H5  10492   Trgt 1
H4  10460   Long breakout
H3  10421   Go Short
H2  10408
H1  10395
L1  10370
L2  10357
L3  10344   Long
L4  10305   Short Breakout
L5  10273   Trgt 1
L6  10241   Trgt 2

Pre-closing Outlook(26-05-2011)

Following line was told in Mid-session Outlook-2 today:-

Next moves preparation range is 5350-5395 and Nifty will trade between this range in the coming hours.

Nifty traded between this range and sharply surged and it is strong indication of strong market and confirmation level is sustaining above 5444. 

Mid-session Outlook-2(26-05-2011)

Last 2 sessions consolidations between 5330-5370 and today some profit booking between 5390-5405. Next moves preparation range is 5350-5395 and Nifty will trade between this range in the coming hours. Let market prepare then view will be formed from intraday charts analysis and will be posted accordingly.

Mid-session Outlook(26-05-2011)


Pull Back rally is being seen today but its possibility has been continuously told in almost all the previous outlooks which were posted in last 2 days and bullish moves technical reasons were also explained in more than 7 previous topics.


Today intra day charts are showing consolidations and move above 5422 will be strong rally confirmation.

NIFTY-MAY F&O-1ST BUYING OF 25-05-2011-COVERING


NIFTY MAY F & O(BOUGHT ON 25-05-2011)-COVER AND BOOK PROFIT IMMEDIATELY(WE SHALL BUY AGAIN BUT FIRST COVER)-CMP-5383

NIFTY-MAY F&O-1ST BUYING OF 25-05-2011-MESSAGE

NIFTY MAY F & O(BOUGHT ON 25-05-2011)-PLEASE DO NOT COVER AT TARGET AND JUST WAIT FOR MY COVERING MESSAGE

Pull Back Rally Possible

Pre-Open Market Outlook(26-05-2011)

Technical Analysis and Researches have already been posted in following topics with 2 Charts therefore not being repeated:-

1- Technical Analysis of EOD Chart and Research For 26-05-2011
2- Nifty-Micro Analysis of Intra Day Chart For 26-05-2011

Conclusions

Indian markets slipped without intraday selling patterns and recent down moves were the impact of melting global markets also therefore Pull Back Rally possibility is strong and may begin any day. Trend reversal pattern of Falling wedge formation in 5th corrective wave therefore correction completion and fresh rally begining is also possible.

As consolidation patterns in the previous 2/3 sessions therefore up moves,Pull Back rally and positive market expected today.

US markets closed with minor gains,Asian markets are positive today morning and sentiment improved therefore positive opening will be seen, Previous sessions consolidations and Bullish trend reversal patterns formations therefore Green closing after whole day positive zone trading expected.

Technical Analysis of EOD Chart and Research For 26-05-2011

EOD Chart(25-05-2011)
Just click on chart for its enlarged view
Main Features

1- 5th Corrective Wave is on
2- Falling Wedge(Bullish Pattern) Formation in 5th corrective Wave
3- Next 1st Support at 5348(Nifty closed at 5,348.95 on 25-05-2011)
4- Next 2nd Support at 5232
5- Next 3rd Support at 5177

Conclusions

All trends are down. 5th wave trend line and rising line continuation pattern has been broken down but Pull back rally and up moves hopes are possible because:-

1- Last 16 sessions down moves are without force.
2- 5th corrective wave is on and up moves are very much technically possible after its completion.
3- Trend reversal pattern Falling Wedge(Bullish Pattern) Formation in 5th corrective Wave.

FII Trading Data in Derivatives Segment on 25-May-2011


Nifty-Micro Analysis of Intra Day Chart For 26-05-2011

Nifty-Intra Day Chart(25-05-2011):-
Just click on chart for its enlarged view
Main Features

1- Falling Channel Pattern
2- Water Fall Bullish Pattern
3- Falling Channel Break Out
4- Consolidations between 5330-5340 in last 3 hours
5- Consolidations between 5342-5355

Conclusions

Technically Indian markets are weak but Pull back rally within couple of sessions was expected after yesterday intraday consolidation but Global storm was so heavy today morning that all the Asian markets were down and resultant Indian markets also could not survived at intraday higher levels and slipped in Water Fall Bullish Pattern(Falling Channel Pattern)

Last 3 hours consolidation between 5330-5355 and bounce back will be seen tomorrow.

Indian Stock Markets Closing Reports(25-05-2011)

Main features of today trading are as follows

1- All the Indices closed in Red except CD.
2- Weaker global cues led whole day negative zone trading.
3- Black Candle.
4- Last 3 hours lower levels consolidations.

Ratios

Nifty Put Call Ratio:  0.84
Nifty P/E Ratio(24-05-2011): 19.90


Advances & Declines

BSE ADVANCES : 1071
BSE DECLINES : 1690
NSE ADVANCES :  477
NSE DECLINES :  917

Nifty Open Interest Changed Today

Nifty- 5300 CE(26-05-2011)- +1998750(+93.28%)
Nifty- 5300 PE(26-05-2011)- +775950(+9.69%)

Nifty- 5400 CE(26-05-2011)- +786550(+12.01%)
Nifty- 5400 PE(26-05-2011)- -1233800(-20.12%)

Nifty- 5500 CE(26-05-2011)- +128950(+1.77%)
Nifty- 5500 PE(26-05-2011)- -1202600(-31.41%)

Closing

Nifty- closed at 5,348.95(-45.90 Points & -0.85%)
Sensex- closed at 17,838.55(-173.42 Points & -0.96% )
CNX MIDCAP - closed at 7,760.00(-23.80 Points & -0.31%)
BSE SMALL CAP- closed at 6,623.16(-38.06 Points & -0.57%)

FII & DII trading activity in Capital Market Segment on 25-May-2011

FII trading activity on NSE and BSE in Capital Mayket Segment(In Rs. Crores)
CategoryDateBuy ValueSell ValueNet Value
FII25-May-20112614.342985.13-370.79


DII trading activity on NSE and BSE in Capital Mayket Segment(In Rs. Crores)
CategoryDateBuy ValueSell ValueNet Value
DII25-May-2011946.27766.86179.41

Nifty Spot-Levels & Trading Strategy for 26-05-2011


Nifty Spot-Levels

R3 5443
R2 5416
R1 5382
Avg 5355
S1 5321
S2 5294
S3 5260

Nifty Spot-Trading Strategy

H6  5409    Trgt 2
H5  5395    Trgt 1
H4  5381    Long breakout
H3  5364    Go Short
H2  5359
H1  5353
L1  5342
L2  5336
L3  5331    Long
L4  5314    Short Breakout
L5  5300    Trgt 1
L6  5286    Trgt 2

Nifty(May Fut)-Levels & Trading Strategy for 26-05-2011


Nifty(May Fut)-Levels

R3 5418
R2 5396
R1 5372
Avg 5350
S1 5326
S2 5304
S3 5280

Nifty(May Fut)-Trading Strategy

H6  5395    Trgt 2
H5  5384    Trgt 1
H4  5374    Long breakout
H3  5361    Go Short
H2  5357
H1  5353
L1  5344
L2  5340
L3  5336    Long
L4  5323    Short Breakout
L5  5313    Trgt 1
L6  5302    Trgt 2

Bank Nifty(May Fut)-Levels & Trading Strategy for 26-05-2011


Bank Nifty(May Fut)-Levels

R3 10507
R2 10473
R1 10418
Avg 10384
S1 10329
S2 10295
S3 10240

Bank Nifty(May Fut)-Trading Strategy

H6  10453   Trgt 2
H5  10433   Trgt 1
H4  10412   Long breakout
H3  10388   Go Short
H2  10380
H1  10372
L1  10355
L2  10347
L3  10339   Long
L4  10315   Short Breakout
L5  10294   Trgt 1
L6  10274   Trgt 2

NIFTY-MAY F&O-1ST BUYING OF 25-05-2011-TRADE


NIFTY(MAY FUT-BUY-POSITIONAL)SL-5324-TGT-5384-CMP-5347

NIFTY(MAY CALL OPTION-BUY-POSITIONAL)SL-5324-TGT-5384-S.P.FOR CALL-5300,5400(MAY FUT-RATES FOR ALL OPTIONS)-CMP-5347

Pre-closing Outlook(25-05-2011)


Whole day down but intra day support seen at lower levels between 5330-5340 in last 3 hours.

Mid-session Outlook-2(25-05-2011)

Almost all the Asian markets were already down and weak Indian markets are pushed down by gap down European markets opening. Global storm is so heavy that next 1st support of 5348 has been broken and next suppot is at 5232. All round weakness and let market bottom out then any upmove will be considered. Continuous down moves today,intraday indicators are in oversold area and showing divergence therefore bounce back possibility can not be ruled out.

Mid-session Outlook(25-05-2011)

Dow's Futures is dipping and trading 100 points down at this moment. As Nifty consolidated between 5367-5422 yesterday therefore did not sustained below 5367 and traded most of the time between given range in first 2 hours with low at 5362.30.

Although consolidation yesterday but Global sentiment is depreseed due to some adverse news from Europe therefore sustaining below 5367-5422 will be watched for next moves confirmations.

Post-open Outlook(25-05-2011)

As US Futures is trading 75 points down today morning therefore Global sentiment is depressed and all Asian markets are trading in negative zone. Although SGX Nifty was 39 points down but opening was expected between 5367-5422 and Nifty is trading between 5372-5389 since opening today. As US Futures is trading 75 points down therefore sentiment is depressed and sustaining beyond 5367-5422 should be watched first for next moves confirmation.

Pre-open Outlook-2(25-05-2011)


US Futures is trading 75 points down today morning therefore Global sentiment is depressed and all Asian markets are trading in nehative zone.

sustaining beyond 5367-5422 will be watched first for next moves confirmation.

Pre-open Outlook(25-05-2011)

All the Asian markets are in Red therefore negative opening expected. As base formation in 2 previous sessions therefore Pull Back Rally expected in the coming sessions but next moves confirmation required today from break out of 5367-5422.

Just watch sustaining beyond 5367-5422 for next moves confirmation.

Pull Back Rally on Cards

Market Outlook
(25-05-2011)

Technical Analysis and Researches have already been posted in following topics with 2 Charts therefore not being repeated:-


1- Technical Analysis of EOD Chart and Research For 25-05-2011
2- Nifty-Micro Analysis of Intra Day Chart For 25-05-2011
3- Nifty- Correction in Continuation pattern Pennant Formations

Conclusions

All trends are down. Correction started from Diwali 2010 day with formation of 'ABC' and correction has been completed at 5177 and after its completion 4th corrective wave has alsocompleted. 5th impulsive wave and Rising Trend Line of Pennant started after that.

5th wave trend line and Rising line continuation Pennant pattern had been broken down in last 2 sessions but down moves were without force. Last 15 sessions down moves were also without force and trend reversal Falling Wedge(Bullish Pattern) Formation seen in 15 previous sessions also.

Nifty traded whole day between 5367-5422 on 24-05-2011 with intraday consolidation patterns and intraday chart formed 5 Waves of Falling Wedge(Bullish) reversal patterns. Some consolidation indications were also seen between 5375-5400 on 23-05-2011.

Strong indications of base formations between 5367-5422 in 2 previous sessions. Break out of 5367-5422 will be watched for next moves confirmations but sustaining above 5422 and begining of pull back rally expected in the coming couple of sessions.

Nifty-Micro Analysis of Intra Day Chart For 25-05-2011


Nifty-Intra Day Chart(24-05-2011):-
Just click on chart for its enlarged view
Main Features

1- Whole day intraday consolidations.
2- 5 Waves of Falling Wedge(Bullish Pattern)
3- Trading range- 5367-5422

Conclusions

Nifty traded whole day between 5367-5422 today with intraday consolidation patterns and intraday chart formed 5 Waves of Falling Wedge reversal patterns therefore Pull back rally is possible in the coming sessions.

FII Trading Data in Derivatives Segment on 24-May-2011


Technical Analysis of EOD Chart and Research For 25-05-2011

 EOD Chart(24-05-2011)
Just click on chart for its enlarged view
Main Features

1- Falling Wedge(Bullish Pattern) Formations in last 15 sessions.
2- Next 1st Support at 5348
3- Next 2nd Support at 5232
4- Next 3rd Support at 5177

Conclusions

All trends are down. 5th wave trend line and rising line continuation pattern has been broken down but Pull back rally and up moves hopes are still alive because last 15 sessions without force down moves and trend reversal Falling Wedge(Bullish Pattern) Formations in last 15 sessions also.

Indian Stock Markets Closing Reports(24-05-2011)

Main features of today trading are as follows

1- Most of the Indices closed flat.
2- Range bound quiet market
3- Most of the Indices and pivotal stocks showed consolidation patterns.

Ratios

Nifty Put Call Ratio: 0.80
Nifty P/E Ratio(24-05-2011): 19.90

Advances & Declines

BSE ADVANCES : 1312
BSE DECLINES : 1470
NSE ADVANCES :  641
NSE DECLINES :  759

Nifty Open Interest Changed Today

Nifty- 5300 CE(26-05-2011)- +821800(+60.55%)
Nifty- 5300 PE(26-05-2011)- +1677350(+25.52%)

Nifty- 5400 CE(26-05-2011)- +345950(+5.23%)
Nifty- 5400 PE(26-05-2011)- +480350(+7.43%)

Nifty- 5500 CE(26-05-2011)- -59350(-0.78%)
Nifty- 5500 PE(26-05-2011)- -342200(-8.02%)

Closing

Nifty- closed at 5,394.85(+8.30 Points & +0.15%)
Sensex- closed at 18,011.97(+18.64 Points & +0.10% )
CNX MIDCAP - closed at 7,783.80(+9.65 Points & +0.12%)
BSE SMALL CAP- closed at 8,053.96(-3.06 Points & -0.04%)

Nifty Spot-Levels & Trading Strategy for 25-05-2011

Nifty Spot-Levels

R3 5476
R2 5449
R1 5421
Avg 5394
S1 5366
S2 5339
S3 5311

Nifty Spot-Trading Strategy

H6 5449     Trgt 2
H5 5436     Trgt 1
H4 5424     Long breakout
H3 5409     Go Short
H2 5404
H1 5399
L1 5388
L2 5383
L3 5378     Long
L4 5363     Short Breakout
L5 5351     Trgt 1
L6 5338     Trgt 2

Nifty(May Fut)-Levels & Trading Strategy for 25-05-2011

Nifty(May Fut)-Levels

R3 5473
R2 5445
R1 5416
Avg 5388
S1 5359
S2 5331
S3 5302

Nifty(May Fut)-Trading Strategy

H6 5444     Trgt 2
H5 5431     Trgt 1
H4 5418     Long breakout
H3 5402      Go Short
H2 5397
H1 5392
L1 5381
L2 5376
L3 5371     Long
L4 5355    Short Breakout
L5 5342     Trgt 1
L6 5329     Trgt 2

Bank Nifty(May Fut)-Levels & Trading Strategy for 25-05-2011

Bank Nifty(May Fut)-Levels

R3 10713
R2 10617
R1 10522
Avg 10426
S1 10331
S2 10235
S3 10140

Bank Nifty(May Fut)-Trading Strategy

H6 10620     Trgt 2
H5 10576     Trgt 1
H4 10533     Long breakout
H3 10480     Go Short
H2 10463
H1 10445
L1 10410
L2 10392
L3 10375     Long
L4 10322     Short Breakout
L5 10279     Trgt 1
L6 10235     Trgt 2

FII & DII trading activity in Capital Market Segment on 24-May-2011

FII trading activity on NSE and BSE in Capital Mayket Segment(In Rs. Crores)
CategoryDateBuy ValueSell ValueNet Value
FII24-May-20112539.942351.78188.16


DII trading activity on NSE and BSE in Capital Mayket Segment(In Rs. Crores)
CategoryDateBuy ValueSell ValueNet Value
DII24-May-2011778.17745.2232.95

Pre-closing Outlook(24-05-2011)


Only trading between 5375-5400 was told and no other projection was given for today market and whole day Nifty hover around this range within 5367-5422 like a romantc youth and also will close within this range.

Following lines were told today in Post-open Outlook(24-05-2011)

First half hour intraday charts did not showed selling patterns today and indications of consolidations patterns also

Today intraday Patterns showed consolidations.

Mid-session Outlook(24-05-2011)

Nifty traded and hovered around 5375-5400 in first 3 hours of today trading. Following lines and this range break out implications have already been told were told in 3 previous outlooks:-

When Dow's Futures was more than 150 points down and Indian markets were trading near day's lows.Sentiment was completely deepressed then bearish views were not expressed and following lines were told in Pre-closing Outlook yesterday:-

"Nifty is trading between 5375-5400 for the last 3 hours and dipping below 4375 will mean begining of deep down and sustaining above 5400 will mean survival of bullush markets hopes."

When US markets were more than 1% down then also bearish views were not expressed and following lines were told in Nifty-Micro Analysis of Intra Day Chart yesterday:-

"As today down moves were the impact of crashing global markets therefore clear selling patterns are required below 5402 for Bearish markets confirmations. Nifty traded last 3 hours between 5375-5400 but patterns are mixed and if Nifty sustains below 5375 tomorrow then deep down will be seen"

Following line was told in Pre-open Outlook today :-

"Sustaining beyond 5375-5400 will be next move decider and will be watched first for next moves confirmations"

Post-open Outlook(24-05-2011)

Nifty traded with mixed intraday patterns between 5375-5400 for the last 3 hours yesterday and in previous 3 outlooks watching of this range and implications of this range was told. Nifty traded most of the time within mentioned range since opening today. First half hour intraday charts did not showed selling patterns today and indications of consolidations patterns also therefore 5375-5418 will be watched for next moves confirmations.

Pre-open Outlook(24-05-2011)

Technical Positions and next possibilities have already been posted in following topic with 7 charts yesterday therefore not repeated today:-

1-Nifty-Micro Analysis of Intra Day Chart(23-05-2011)
2-Weekly Outlook(May 23 to May 27,2011)

US markets closed more then 1% down yesterday but Asian markets are almost flat therefore sentiment is quiet and Indian markets opening will be almost flat.

All trends are down and all the technical indicators are suggesting Bearish markets. Last confirmation point is sustaining below 5444. Nifty traded whole day below it yesterday and also moved bolow strong support(5402).

As yesterday down moves were the impact of crashing global markets therefore clear selling patterns are required below 5402 for Bearish markets confirmations. Nifty traded last 3 hours between 5375-5400 yesterday but patterns were mixed and if Nifty sustains below 5375 today then it will be bear market confirmation and in that situation Indian markets will be deep down. Sustaining above 5400 will mean alive of Bullish markets expectations and crossing 5444 will be sigh of releaf of Bulls.

Sustaining beyond 5375-5400 will be next move decider and will be watched first for next moves confirmations.

Nifty-Micro Analysis of Intra Day Chart(23-05-2011)


Nifty- Intra Day Chart(23-05-2011):-
Just click on chart for its enlarged view
Main Features

1- Selling between 5418-5436
2- Last 3 hours mixed patterns between 5375-5400

Conclusions

All trends are down and all the technical indicators are suggesting Bearish markets. Last confirmation point is sustaining below 5444. Nifty traded whole day below it and also moved bolow strong support(5402).

As today down moves were the impact of crashing global markets therefore clear selling patterns are required below 5402 for Bearish markets confirmations. Nifty traded last 3 hours between 5375-5400 but patterns are mixed and if Nifty sustains below 5375 tomorrow then deep down will be seen.

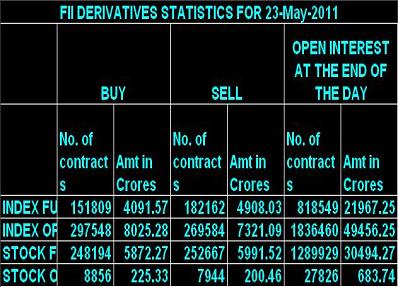
FII Trading Data in Derivatives Segment on 23-May-2011


FII & DII trading activity in Capital Market Segment on 23-May-2011

FII trading activity on NSE and BSE in Capital Mayket Segment(In Rs. Crores)
CategoryDateBuy ValueSell ValueNet Value
FII23-May-20111959.212252.77-293.56


DII trading activity on NSE and BSE in Capital Mayket Segment(In Rs. Crores)
CategoryDateBuy ValueSell ValueNet Value
DII23-May-20111070875.78194.22

Indian Stock Markets Closing Reports(23-05-2011)


Main features of today trading are as follows

1- Global cues led deep Red closing today.
2- Nifty traded more than 3 hours below 5400.
3- All the Indices closed in Red except FMCG and CD.

Ratios

Nifty Put Call Ratio: 0.91
Nifty P/E Ratio(20-05-2011): 20.34

Advances & Declines

BSE ADVANCES : 813
BSE DECLINES : 1976
NSE ADVANCES : 252
NSE DECLINES : 41

Nifty Open Interest Changed Today

Nifty- 5300 CE(26-05-2011)- +1096650(+442.73%)
Nifty- 5300 PE(26-05-2011)- +595250(+9.80%)

Nifty- 5400 CE(26-05-2011)- +2919000(+76.16%)
Nifty- 5400 PE(26-05-2011)- -1014600(-12.74%)

Nifty- 5500 CE(26-05-2011)- +1030400(+15.64%)
Nifty- 5500 PE(26-05-2011)- -1167050(-20.86%)

Closing

Nifty- closed at 5,386.55(-99.80 Points & -1.82%%)
Sensex- closed at 17,993.33(-332.76 Points & -1.82% )
CNX MIDCAP - closed at 7,774.15 (-99.00 Points & -1.26%)
BSE SMALL CAP- closed at 8,057.02(-128.16 Points & -1.57%)

Nifty Spot-Levels & Trading Strategy for 24-05-2011

Nifty Spot-Levels


R3 5520
R2 5488
R1 5437
Avg 5405
S1 5354
S2 5322
S3 5271


Nifty Spot-Trading Strategy

H6   5469   Trgt 2
H5   5450   Trgt 1
H4   5431   Long breakout
H3   5408   Go Short
H2   5401
H1   5393
L1   5378
L2   5370
L3   5363   Long
L4   5340   Short Breakout
L5   5321   Trgt 1
L6   5302   Trgt 2

Bank Nifty(May Fut)-Levels & Trading Strategy for 24-05-2011

Bank Nifty(May Fut)-Levels

R3 10797
R2 10698
R1 10528
Avg 10429
S1 10259
S2 10160
S3 9990

Bank Nifty(May Fut)-Trading Strategy

H6 10627 Trgt 2
H5 10566 Trgt 1
H4 10505 Long breakout
H3 10431 Go Short
H2 10407
H1 10382
L1 10333
L2 10308
L3 10284 Long
L4 10210 Short Breakout
L5 10149 Trgt 1
L6 10088 Trgt 2

Nifty(May Fut)-Levels & Trading Strategy for 24-05-2011

Nifty(May Fut)-Levels

R3 5501
R2 5470
R1 5426
Avg 5395
S1 5351
S2 5320
S3 5276

Nifty(May Fut)-Trading Strategy

H6  5458   Trgt 2
H5  5441    Trgt 1
H4  5424    Long breakout
H3  5403    Go Short
H2  5396
H1  5389
L1  5376
L2  5369
L3  5362    Long
L4  5341    Short Breakout
L5  5324    Trgt 1
L6  5307    Trgt 2

Pre-closing Outlook(23-05-2011)

Dow's Futures is more than 150 points down today therefore sentiment is depressed and all the Asian markets closed in deep Red today.Indian markets are could not survived and Nifty slipped and trading below 5400 also.

As soon as selling started to develop then it was informed and following line was clearly  told at 09:52 AM today in Post-open Outlook(23-05-2011):-

"Weak opening and first half hour intraday charts selling patterns"

As sentiment is news based and completely depressed therefore sustaining below 5400 require more confirmations. Nifty is trading between 5375-5400 for the last 3 hours and dipping below 4375 will mean begining of deep down and sustaining above 5400 will mean survival of bullush markets hopes.

Post-open Outlook-2(23-05-2011)

Today weak opening and first hour trading between 5419-5436 with first half hour selling patterns. Strong support range is 5402-5431 and Nifty is trading within and little above this range. Although first half hour intraday sellng patterns but market requires complete selling patterns for Nifty below 5400.

As today weakness is global cues based,sentiment is extremely deprssed therefore voltality may also be seen. Sometimes markets get support in today like depressed sentiments therefore sustaining beyond 5400-5440  will be watched for next immediate move confirmations.

Let market prepare and intraday charts mature for next moves then final conclusions will be drawn.

Post-open Outlook(23-05-2011)


Weak opening and first half hour intraday charts selling patterns.

Pre-open Outlook(23-05-2011)


Technical Positions,today Outlook and next possibilities have already been posted in following topic with 1 Chart therefore not repeated today:-

"Weekly Outlook(May 23 to May 27,2011)"

Dow's Futures is more than 80 points down today and  US markets closed  weak last Friday therefore sentiment is depressed and all the Asian markets are in deep Red today morning. Indian markets are already range bound with strong support between 5402-5431 and good selling at higher levels also therefore weak opening and firstly trading between 5420-5460 expected.

Most of the time Red zone trading expected and Red closing may also be seen but intraday chart formation of today will decide coming sessions markets. Let Indian markets prepare then next moves will be decided according to today intraday charts patterns.

Weekly Outlook(May 23 to May 27,2011)

Detailed Technical Analysis and Researches have been posted in following 5 topics with EOD and Daily Charts and technical reasons for next moves have been explained:-

1- Nifty-Averages and Indicators Analysis
2- Nifty-Elliot Waves Structure
3- Nifty- Correction in Continuation pattern Pennant Formations
4- Nifty-Micro Analysis of 10 Days Intra Day Chart
5- Nifty-Micro Analysis of Intra Day Chart(20-05-2011)

Conclusions (After Putting All Studies Together)

Nifty is sustaining below 50(5619) and 200 DaY EMA(5616) for the last 14 sessions therefore Intermediate and long term trends are down. Diwali 2010 started correction was in the form of 'ABC' Correction and this correction has been completed at 5177 and after its completion 4th corrective wave has also completed. 5th impulsive wave is on and it is in the form of Rising Trend Line of Pennant but it was broken down last week,Nifty  nicely consolidated 4 days below it and after that strong upmove seen last Friday.

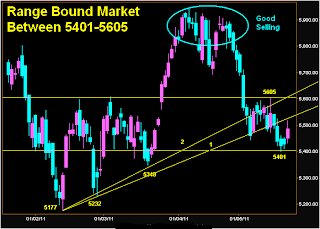
Range Bound Market Between 5401-5605 Chart
Just click on chart for its enlarged view
Nifty is trading between 5401-5605 for the last 14 sessions. Supports and Resistances within this range are as follows;-

1- Support and Base formation between 5402-5431
2- Minor selling between 5505-5517
3- Resistance between 5520-5530
3- Resistance between 5540-5605

Huge selling above this range. Supports below that range are as follows;-

1- 5348
2- 5232
3- 5177
Strong lower levels consolidations in previous week but resistances at higher levels are also equally strong. Indian markets have to prepare for next sustained and decisive moves and it will be done in first couple of sessions within 5444-5500. Indian markets are preparing for next moves between 5401-5605 and sustaining beyond this range will be next moves confirmations. As market is not trending but range bound therefore next trend view will be formed according to coming sessions intraday charts patterns.

As Wave-5 and continuation pattern Pennant are intact therefore upmoves hopes are still alive and also expected that Indian markets will consolidate in the coming sessions and upward break out will be seen in the coming week..