Donald Trump sweeping tariffs led crashing like situation in all the Global Financial Markets & watch next supports one by one for next Short Term moves beginning confirmations
Technical Analysis,Research & Weekly Outlook
(Apr 07 to Apr 11,2025)
Nifty-EOD Chart Analysis
(Waves structure)
Nifty-EOD Chart (04-Apr-2025):-

Technical Patterns and Formations in EOD charts
1- Wave-C of Wave-(ii) of Wave-3 completion at 18837.80 on 26-10-2023 and impulsive Wave-(iii) of Wave-3 beginning.
2- Impulsive Wave-(iii) of Wave-3 completion with new life time top formations at 26277.30 on 27-09-2024 and Corrective Wave-A of Wave-(iv) of Wave-3 of "ABC" correction beginning.
3- Corrective Wave-A of Wave-(iv) of Wave-3 completion at 23263.20 on 21-11-2024.
4- Corrective Wave-B of Wave-(iv) of Wave-3 completion at 24857.80 on 05-12-2024.
5- Corrective Wave-C of Wave-(iv) of Wave-3 continuation with recent bottom formations 21964.60 on 04-03-2025 and Pull Back Rally beginning from this level.
6- Pull Back Rally completion at 23869.60 on 25-03-2025.
7- Correction continuation with recent bottom formations at 22857.45 on 04-04-2025.
Conclusions from EOD chart analysis
(Waves structure)
Wave-C of Wave-(ii) of Wave-3 completed at 18837.80 on 26-10-2023 and from this level impulsive Wave-(iii) of Wave-3 begun which completed with new life time top formations at 26277.30 on 27-09-2024 and from this level corrective Wave-A of Wave-(iv) of Wave-3 of "ABC" correction started.
Corrective Wave-A of Wave-(iv) of Wave-3 completed at 23263.20 on 21-11-2024 and Wave-B of Wave-(iv) of Wave-3 begun from this levels which completed at 24792.30 on 13-12-2024 and from this levels corrective Wave-C of Wave-(iv) of Wave-3 started which is is now in continuation with recent bottom formations at 21964.60 on 04-03-2025. The Pull Back Rally which begun from the recent lowest of Wave-C completed at 23869.60 on 25-03-2025 and from this level again correction started which is now in continuation with recent bottom formations at 22857.45 on 04-04-2025.
Nifty-EOD Chart Analysis
(Stochastic & MACD)
Nifty-EOD Chart (04-Apr-2025):-

Technical Patterns and Formations in EOD charts
1- Stochastic- %K(5) line has intersected %D(3) line downward and its both lines are falling towards Over sold zone.
2- Stochastic:- %K(5)- 20.25 & %D(3)- 19.96.
3- In MACD- MACD line has intersected Average line upward. Its MACD line is falling and Average line is rising in positive zone.
4- MACD(26,12)- 524.34 & EXP(9)- 472.58 & Divergence- 51.76
Conclusions from EOD chart analysis
(Stochastic & MACD)
Technical positions of Short Term indicators are as follows:-
1- As in Short Term indicator Stochastic its %K(5) line has intersected %D(3) line downward and its both lines are falling towards Over sold zone and have not turned completely Over sold yet therefore it will be understood that this indicator is suggesting on going Short Term correction continuation possibility in the coming week.
2- As in MACD indicator its MACD line has intersected Average line upward and now its MACD line is falling and Average line is rising in positive zone. therefore it will be understood that this indicator is signalling the possibility of Short Term upward trend completion and and Short Term downward trend beginning possibility also.
Nifty-EOD Chart Analysis
(Averages)
Nifty-EOD Chart (04-Apr-2025):-

Technical Patterns and Formations in EOD charts
Averages:-
1- 5-Day SMA is today at 23234(Very Short Term Trend decider)
2- 21-Day SMA is today at 22982(Short Term Trend decider)
3- 55-Day SMA is today at 23019(Intermediate Term Trend decider)
4- 100-Day SMA is today at 23444
5- 200-Day SMA is today at 24076(Long Term Trend decider)
Conclusions from EOD chart analysis
(Averages)
As Nifty has closed below all the Short to Long Term Averages last Friday therefore all the Trends have turned down in previous week sharp fall and it is suggesting on going correction continuation possibility also in the coming week/weeks.
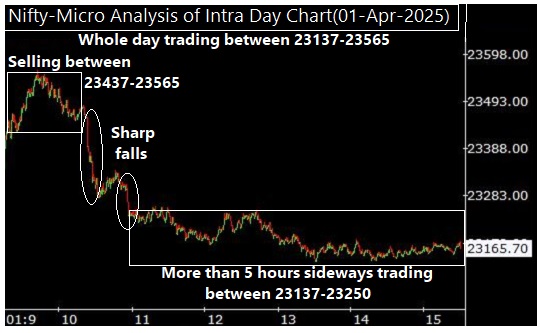
Nifty-Intra Day Chart Analysis
(04-Apr-2025)
Nifty-Intra Day Chart (04-Apr-2025):-

Technical Patterns formation in today intraday charts
1- 210 Points down in first 10 minutes after weaker opening.
2- Volatility between 23049-23142
3- Selling between 22858-23026
4- Whole day trading between 22858-23214
Conclusions from intra day chart analysis
As firstly 210 Points down in first 10 minutes after weaker opening and after that Volatility between 23049-23142 as well as more than 5 hours selling between 22858-23026 therefore more downward moves are expected in the beginning of next week.
Conclusions
(After putting all studies together)
1- Short Term Trend is down.
2- Intermediate Term Trend is down.
3- Long Term Trend is down.
Corrective Wave-A of Wave-(iv) of Wave-3 of "ABC" correction begun after impulsive Wave-(iii) of Wave-3 completion with new life time top formations at 26277.30 on 27-09-2024. Now its corrective Wave-C of Wave-(iv) of Wave-3 in continuation with recent bottom formations at 21964.60 on 04-03-2025. Although strong Pull Back Rally started from this level but completed at 23869.60 on 25-03-2025 and from this level again correction begun which is now in continuation with recent bottom formations at 22857.45 on 04-04-2025.
As Short Term indicator Stochastic is signalling on going Short Term correction continuation possibility and another MACD indicator is also showing the possibility of Short Term upward trend completion as well as Short Term downward trend beginning possibility therefore it will be understood that Short Term indicators are suggesting that more downward moves will be seen in the coming/weeks.
All the Short to Long Term Averages are confirming that all the Trends have turned down after previous week sharp fall and on going correction continuation possibility also in the coming week/weeks.
As US President Donald Trump announced sweeping tariffs on goods from countries across the world on 02-03-2025 therefore since then most Global Stock Markets are in crashing mode and in following manner closed in deep Red last Friday:-
Dow Jones(USA) closed 2,231.07 Points(-5.50%) down.
S&P 500(USA) closed 322.47 Points(-5.98%) down.
Nasdaq(USA) closed 962.82 Points(-5.82%) down.
DAX(Germany) closed 1,075.67 Points(-4.95%) down.
FTSE 100(England) closed 419.76 Points(-4.95%) down.
CAC 40(France) closed 324.03 Points(-4.26%) down.
Nikkei 225(Japan) closed 955.35 Points(-2.75%) down.
Hang Seng(Hong Kong) closed 352.72 Points(-1.52%) down.
Almost all the Indian Stock markets Indices closed in Red last Friday and in following manner all main Indices closed last Friday:-
NIFTY 50 closed 345.65 Points(-1.49%) down.
NIFTY BANK closed 94.65 Points(-0.18%) down.
NIFTY IT closed 1,245.80 Points(-3.58%) down.
NIFTY MIDCAP 100 closed 1,516.20 Points(-2.91%) down.
NIFTY SMLCAP 100 closed 579.50 Points(-3.56%) down.
All the Commodities in Indian markets in following manner closed in Red last Friday:-
GOLD closed Rs 1927.00(-2.14%) down.
SILVER closed Rs 6968.00(-7.38%) down.
CRUDEOIL closed Rs 403.00(-7.03%) down.
NATURAL GAS closed Rs 24.20(-6.84%) down.
ALUMINIUM closed Rs 6.20(-2.60%) down.
COPPER closed Rs 62.00(-7.16%) down.
LEAD closed Rs 2.55(-1.43%) down.
ZINC closed Rs 5.05(-1.96%) down.
As US President Donald Trump sweeping tariffs led crashing like situation in all the Global financial markets therefore on going correction continuation is expected towards following next supports which should be watched one by one for next Short Term moves beginning confirmations:-
1- 22577-22599(Gap supports)
2- 23446-23529
3- 22307-22375
4- 22239-22271
5- 21987-22142(Strong supports)
5- 21502-21582
7- 21417-21500