Technical Analysis,Research & Weekly Outlook
(Sep 17 to Sep 21,2012)
Nifty-Intra Day Chart (14-Sep-2012):- |
| Just click on chart for its enlarged view |
1- Consolidation between 5545-5570
2- Whole day trading between 5528-5585
Conclusions from intra day chart analysis
Most time intraday consolidations and on going rally continuation is expected.
Nifty-EOD Chart (14-Sep-2012):-
 |
| Just click on chart for its enlarged view |
1- 4531.15 on 20-12-2011
2- Wave-1(5629.95 on 22-02-2012)
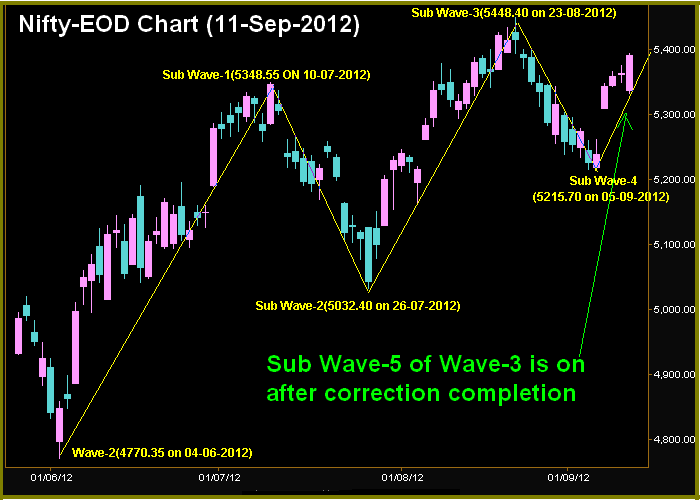
3- Wave-2(4770.35 on 04-06-2012)
4- Sub Wave-1(5348.55 ON 10-07-2012)
5- Sub Wave-2(5032.40 on 26-07-2012)
6- Sub Wave-3(5448.40 on 23-08-2012)
7- Sub Wave-4(5215.70 on 05-09-2012)
8- Sub Wave-5 of Wave-3 is on
Conclusions (After Putting All Studies Together)
All trends are up and participation in Fed triggered Global markets rally through 80 points huge gap up opening on 14-09-2012. As previous session up moves with intraday consolidation patterns therefore rally continuation is expected in the coming week as well as new top of 2012 will also be seen.