As busy therefore Stock Market Outlook of today(23-02-2018) is not being updated

ॐ ह्रीं श्रीं लक्ष्मीभयो नमः॥

Emergence of Pull Back Rally possibility
Intra Day Chart Analysis & Market Outlook
(22-02-2018)
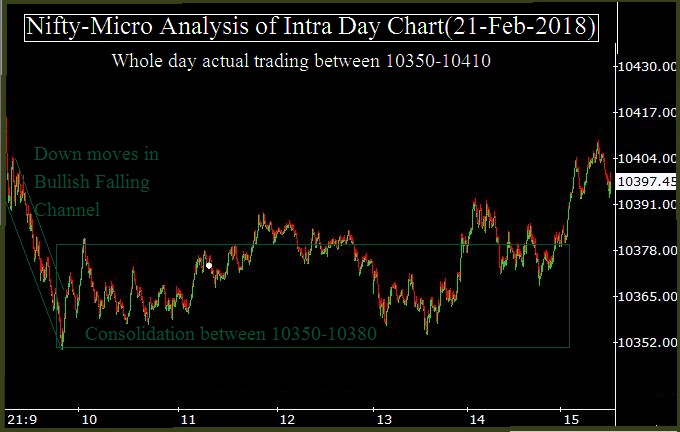
Nifty-Intra Day Chart (21-Feb-2018):-
 |
| Just click on chart for its enlarged view |
1- Down moves in Bullish Falling Channel
2- Consolidation between 10350-10380
3- Whole day actual trading between 10350-10410
Conclusions from intra day chart analysis
Although selling was seen between 10380-10429 yesterday but fresh consolidation just below it between 10350-10380 today therefore emergence of Pull Back Rally possibility in the coming sessions but follow up consolidation is must for sustaining above 10429.
Finally slipping below immediate supports of Nifty
Intra Day Chart Analysis & Market Outlook
(21-02-2018)
Nifty-Intra Day Chart (20-Feb-2018):-
 |
| Just click on chart for its enlarged view |
1- Selling between 10380-10429
2- Sharp fall in last hour
3- Whole day actual trading between 10348-10429
Conclusions from intra day chart analysis
As firstly more than 5 hours selling and after that sharp fall in last hour therefore on going correction continuation is expected in the coming sessions.
Following lines were told on 18-02-2018 in "Firstly watch levels for next week big moves confirmations":-
1- firstly valid break out of last 7 Sessions trading range(10399-10637) will be watched for correction cotinuation towards next supports(10277-10372) below 10399 or first storng signal of correction completion above 10612.
2- high possibility of correction continuation after fresh selling
Correction remained contined in both previous sessions and today closing was within above mentioned next supports(10277-10372) at 10360.40 today.
Nifty got supports between 10304-10342 yesterday and closed above it today but after fresh selling between 10380-10429 therefore expected that Nifty will firstly trade and prepare for next decisive moves between 10304-10429 tomorrow.
Although immediate supports of Nifty are between 10277-10342 but higher levels good selling in previous weeks therefore expected that finally Nifty will slip below 10277 after fresh selling in the coming 1/2 sessions.
Firstly watch levels for next week big moves confirmations
Intra Day Chart Analysis & Market Outlook
(19-02-2018)
Nifty-Intra Day Chart (16-Feb-2018):-
 |
| Just click on chart for its enlarged view |
 |
| Just click on chart for its enlarged view |
1- Down moves in Bullish Falling Channel
2- Selling between 10494-10523
3- Bullish Falling Wedge like formations in last hours between 10435-10462
4- Whole day actual trading between 10435-10612
Conclusions from intra day chart analysis
Although closing at lower levels of the day after 0.88% negative closing last Friday but consolidation patterns formations were also seen therefore view will be cautious and firstly valid break out of last 7 Sessions trading range(10399-10637) will be watched for correction cotinuation towards next supports(10277-10372) below 10399 or first storng signal of correction completion above 10612.
As most Global markets were strong but Indian markets weakness last Friday is telling that Indian markets under performed therefore high possibility of correction continuation after fresh selling but precautionally valid break out of 10399-10637 should also be watched in next week for big moves confirmations.
Subscribe to:
Posts (Atom)