| FII trading activity on NSE and BSE in Capital Market Segment(In Rs. Crores) |
| Category | Date | Buy Value | Sell Value | Net Value |
| FII | 10-May-2013 | 2395.67 | 1851.56 | 544.11 |
|
|
| DII trading activity on NSE and BSE in Capital Market Segment(In Rs. Crores) |
| Category | Date | Buy Value | Sell Value | Net Value |
| DII | 10-May-2013 | 755.87 | 1258.19 | -502.32 | | |
Main features of today trading are as follows
Ratios
Index Options Put Call Ratio: 1.01
Total Options Put Call Ratio: 0.97
Nifty P/E Ratio(10-May-2013): 18.07
Advances & Declines
BSE Advances : 1,199
BSE Declines : 1,233
NSE Advances : 700
NSE Declines : 712
Nifty Open Interest Changed Today
Nifty- 5800 CE(May)- -33,050(-1.53%)
Nifty- 5800 PE(May)- -135,850(-1.49%)
Nifty- 5900 CE(May)- -519,600(-14.58%)
Nifty- 5900 PE(May)- 218,500(3.08%)
Nifty- 6000 CE(May)- -308,650(-6.12%)
Nifty- 6000 PE(May)- 335,000(5.62%)
Nifty- 6100 CE(May)- 222,550(4.20%)
Nifty- 6100 PE(May)- 1,108,250(56.63%)
Nifty- 6200 CE(May)- 1,171,400(17.10%)
Nifty- 6200 PE(May)- 183,600(25.31%)
Closing
Sensex- closed at 20,082.62(143.58 Points & 0.72%)
Nifty- closed at 6,094.75(44.60 Points & 0.74%)
CNX Midcap - closed at 8,009.45(25.65 Points & 0.32%)
CNX Smallcap- closed at 3,070.15(21.15 Points & 0.69%)
Nifty Spot-Levels
R3 6201
R2 6157
R1 6132
Avg 6088
S1 6063
S2 6019
S3 5994
Nifty Spot-Trading Strategy
H6 6176 Trgt 2
H5 6160 Trgt 1
H4 6144 Long breakout
H3 6125 Go Short
H2 6119
H1 6113
L1 6100
L2 6094
L3 6088 Long
L4 6069 Short Breakout
L5 6053 Trgt 1
L6 6037 Trgt 2
Nifty(May Fut)-Levels
R3 6233
R2 6181
R1 6149
Avg 6097
S1 6065
S2 6013
S3 5981
Nifty(May Fut)-Trading Strategy
H6 6203 Trgt 2
H5 6183 Trgt 1
H4 6164 Long breakout
H3 6141 Go Short
H2 6133
H1 6125
L1 6110
L2 6102
L3 6094 Long
L4 6071 Short Breakout
L5 6052 Trgt 1
L6 6032 Trgt 2
Bank Nifty(May Fut)-Levels
R3 13133
R2 12961
R1 12855
Avg 12683
S1 12577
S2 12405
S3 12299
Bank Nifty(May Fut)-Trading Strategy
H6 13032 Trgt 2
H5 12967 Trgt 1
H4 12901 Long breakout
H3 12825 Go Short
H2 12799
H1 12774
L1 12723
L2 12698
L3 12672 Long
L4 12596 Short Breakout
L5 12530 Trgt 1
L6 12465 Trgt 2
Nifty was trading at 6050 at 12:30 PM but moved sharply immediately after strong opening of European markets and today up moves were fuelled by strong up moves in US Futures also. As IIP numbers also improved therefore strong rally seen after its announcements. Now trading near the top of last resistance range(6050-6105) of on going rally. As today up moves are completely news based therefore finally sustaining above 6105 should be watched for strong rally above 6111.
Nifty-Intra Day Chart (09-May-2013):-
 |
| Just click on chart for its enlarged view |
Technical Patterns and Formations in today intraday charts
1- Selling between 6070-6082
2- Whole day actual trading between 6040-6082
Conclusions from intra day chart analysis
All trends are up and impulsive Wave-5 continuation but Indicators are overbought and suggesting for correction. Although complete selling patterns on daily charts are required for any deeper correction but Short Term correction is very much possible after any day higher levels intraday selling. As intraday selling patterns formations yesterday therefore minimum Short Term correction will be seen today.
Support were seen between 6024-6040 on 08-05-2013 and expected that Nifty will firstly trade within this range today. As higher levels selling yesterday therefore firstly sustaining beyond 6024 should be watched today for range bound correction between 6024-6083 or little deeper correction toward 5985.
| FII trading activity on NSE and BSE in Capital Market Segment(In Rs. Crores) |
| Category | Date | Buy Value | Sell Value | Net Value |
| FII | 09-May-2013 | 2249.43 | 1586.55 | 662.88 |
|
|
| DII trading activity on NSE and BSE in Capital Market Segment(In Rs. Crores) |
| Category | Date | Buy Value | Sell Value | Net Value |
| DII | 09-May-2013 | 736.23 | 1212.92 | -476.69 | | |
Main features of today trading are as follows
Ratios
Index Options Put Call Ratio: 1.17
Total Options Put Call Ratio: 1.09
Nifty P/E Ratio(09-May-2013): 18.00
Advances & Declines
BSE Advances : 1,084
BSE Declines : 1,319
NSE Advances : 596
NSE Declines : 829
Nifty Open Interest Changed Today
Nifty- 5700 CE(May)- -14,100(-0.85%)
Nifty- 5700 PE(May)- 675,450(8.71%)
Nifty- 5800 CE(May)- -23,350(-1.07%)
Nifty- 5800 PE(May)- 326,450(3.71%)
Nifty- 5900 CE(May)- -293,350(-7.61%)
Nifty- 5900 PE(May)- 76,800(1.09%)
Nifty- 6000 CE(May)- 69,500(1.40%)
Nifty- 6000 PE(May)- 237,000(4.14%)
Nifty- 6100 CE(May)- 95,050(1.83%)
Nifty- 6100 PE(May)- 294,700(%)
Nifty- 6200 CE(May)- 610,350(9.78%)
Nifty- 6200 PE(May)- -10,850(-1.47%)
Closing
Sensex- closed at 19,939.04(-51.14 Points & -0.26%)
Nifty- closed at 6,050.15(-19.15 Points & -0.32%)
CNX Midcap - closed at 7,983.80(-58.35 Points & -0.73%)
CNX Smallcap- closed at 3,338.20(-8.85 Points & -0.26%)
Nifty Spot-Levels
R3 6120
R2 6102
R1 6076
Avg 6058
S1 6032
S2 6014
S3 5988
Nifty Spot-Trading Strategy
H6 6094 Trgt 2
H5 6084 Trgt 1
H4 6074 Long breakout
H3 6062 Go Short
H2 6058
H1 6054
L1 6045
L2 6041
L3 6037 Long
L4 6025 Short Breakout
L5 6015 Trgt 1
L6 6005 Trgt 2
Nifty(May Fut)-Levels
R3 6131
R2 6110
R1 6079
Avg 6058
S1 6027
S2 6006
S3 5975
Nifty(May Fut)-Trading Strategy
H6 6094 Trgt 2
H5 6084 Trgt 1
H4 6074 Long breakout
H3 6062 Go Short
H2 6058
H1 6054
L1 6045
L2 6041
L3 6037 Long
L4 6025 Short Breakout
L5 6015 Trgt 1
L6 6005 Trgt 2
Bank Nifty(May Fut)-Levels
R3 12841
R2 12761
R1 12645
Avg 12565
S1 12449
S2 12369
S3 12253
Bank Nifty(May Fut)-Trading Strategy
H6 12725 Trgt 2
H5 12681 Trgt 1
H4 12636 Long breakout
H3 12582 Go Short
H2 12564
H1 12546
L1 12511
L2 12493
L3 12475 Long
L4 12421 Short Breakout
L5 12376 Trgt 1
L6 12332 Trgt 2
Although Last Traded Price of Nifty was at the highest of the day(6083) yesterday but we were not Bullish because intraday showed selling patterns indications between 6050-6065 in last more than 2 hours yesterday. We clearly told the condition of sustaining above 6083 in both previous Outlooks.
As was suspected same happened and Nifty traded whole day below 6083 today with intraday selling patterns at higher levels therefore Short Term Correction is expected now.
As selling patterns indications at higher levels seen in last more than 2 hours yesterday therefore following line was told today at 01:13 AM in Technical Analysis and Market Outlook(09-05-2013)
1- selling patterns indications at higher levels seen in last more than 2 hours
2- sustaining above yesterday high(6083) should be firstly watched today for immediate next up moves confirmations.
Selling indications between 6050-6065 yesterday and Nifty traded most time between this range today. Follow up moves between this range will give first indication of next immediate moves and its valid break out should be firstly watched today.
Nifty-Intra Day Chart (08-May-2013):-
 |
| Just click on chart for its enlarged view |
Technical Patterns and Formations in today intraday charts
1- Support between 6024-6040
2- Selling indications 6050-6065
3- Whole day actual trading between 6024-6083
Conclusions from intra day chart analysis
All trends are up and impulsive Wave-5 continuation but Indicators are overbought and suggesting for correction. As complete selling patterns on daily charts are required for any deeper correction and no such patterns formations yet therefore any deeper correction will not be considered at this moment. Many times Bullish markets complete its corrections between sideways moves or at higher levels consolidations therefore such type of corrections should be kept in mind.
Lower levels supports and selling patterns indications at higher levels seen in last more than 2 hours therefore mixed patterns formations on 08-05-2013. Next strong resistance are between 6050-6105 and complete consolidations patterns are required for crossing and sustaining above 6105 but Nifty traded between this range with selling patterns indications therefore sustaining above yesterday high(6083) should be firstly watched today for immediate next up moves confirmations.
As complete selling patterns are required for any deeper correction and no such formation seen yet therefore rally continuation is expected after follow up consolidations within mentioned resistance range.
| FII trading activity on NSE and BSE in Capital Market Segment(In Rs. Crores) |
| Category | Date | Buy Value | Sell Value | Net Value |
| FII | 08-May-2013 | 3036.88 | 2059.89 | 976.99 |
|
|
| DII trading activity on NSE and BSE in Capital Market Segment(In Rs. Crores) |
| Category | Date | Buy Value | Sell Value | Net Value |
| DII | 08-May-2013 | 782.24 | 1451.32 | -669.08 | | |
Main features of today trading are as follows
Ratios
Index Options Put Call Ratio: 1.00
Total Options Put Call Ratio: 0.96
Nifty P/E Ratio(08-May-2013): 18.03
Advances & Declines
BSE Advances : 1,238
BSE Declines : 1,194
NSE Advances : 715
NSE Declines : 700
Nifty Open Interest Changed Today
Nifty- 5800 CE(May)- -115,650(-5.02%)
Nifty- 5800 PE(May)- 278,000(3.26%)
Nifty- 5900 CE(May)- -768,950(-16.63%)
Nifty- 5900 PE(May)- 573,650(8.90%)
Nifty- 6000 CE(May)- -22,000(-0.44%)
Nifty- 6000 PE(May)- 934,850(19.53%)
Nifty- 6100 CE(May)- 166,950(3.32%)
Nifty- 6100 PE(May)- 487,700(41.52%)
Nifty- 6200 CE(May)- 623,850(11.11%)
Nifty- 6200 PE(May)- -250(-0.03%)
Closing
Sensex- closed at 19,990.18(101.23 Points & 0.51%)
Nifty- closed at 6,069.30(25.75 Points & 0.43%)
CNX Midcap - closed at 8,042.15(2.50 Points & 0.03%)
CNX Smallcap- closed at 3,347.05(31.90 Points & 0.96%)
Nifty Spot-Levels
R3 6152
R2 6117
R1 6093
Avg 6058
S1 6034
S2 5999
S3 5975
Nifty Spot-Trading Strategy
H6 6128 Trgt 2
H5 6114 Trgt 1
H4 6101 Long breakout
H3 6085 Go Short
H2 6079
H1 6074
L1 6063
L2 6058
L3 6052 Long
L4 6036 Short Breakout
L5 6023 Trgt 1
L6 6009 Trgt 2
Nifty(May Fut)-Levels
R3 6165
R2 6127
R1 6101
Avg 6063
S1 6037
S2 5999
S3 5973
Nifty(May Fut)-Trading Strategy
H6 6139 Trgt 2
H5 6124 Trgt 1
H4 6110 Long breakout
H3 6092 Go Short
H2 6086
H1 6080
L1 6069
L2 6063
L3 6057 Long
L4 6039 Short Breakout
L5 6025 Trgt 1
L6 6010 Trgt 2
Bank Nifty(May Fut)-Levels
R3 12881
R2 12770
R1 12687
Avg 12576
S1 12493
S2 12382
S3 12299
Bank Nifty(May Fut)-Trading Strategy
H6 12800 Trgt 2
H5 12755 Trgt 1
H4 12710 Long breakout
H3 12657 Go Short
H2 12639
H1 12621
L1 12586
L2 12568
L3 12550 Long
L4 12497 Short Breakout
L5 12452 Trgt 1
L6 12407 Trgt 2
Whole day sideways trading between 6026-6068 with lower levels supports and higher levels selling patterns indications. All trends are up and now trading near the highs of on going rally as well as today trading near the lower levels of next strong resistance range(6050-6105).
As indicators are overbought therefore correction is due and some selling indications have emerged at higher levels today therefore sustaining beoynd today trading range will be firstly watched tomorrow for next moves confirmations because lower levels supports also seen today.
Following lives were told yesterday in Rally continuation
1- minor corrections will be considered at this moment
2- Next strong resistances are between 6050-6105 and market requires complete follow up consolidations for crossing and sustaining above it
Firstly Nifty traded almost 2 hours within mentioned resistance range and slipped below it as well but intraday patterns are not showing selling patterns and suggesting consolidations patterns formations. As market requires complete follow up consolidations for crossing and sustaining above mentioned resistance range therefore Nifty will hover around this range(6050-6105) in the coming sessions and prepare for next up moves above 6111 after completion of minor corrections.
Rally continuation
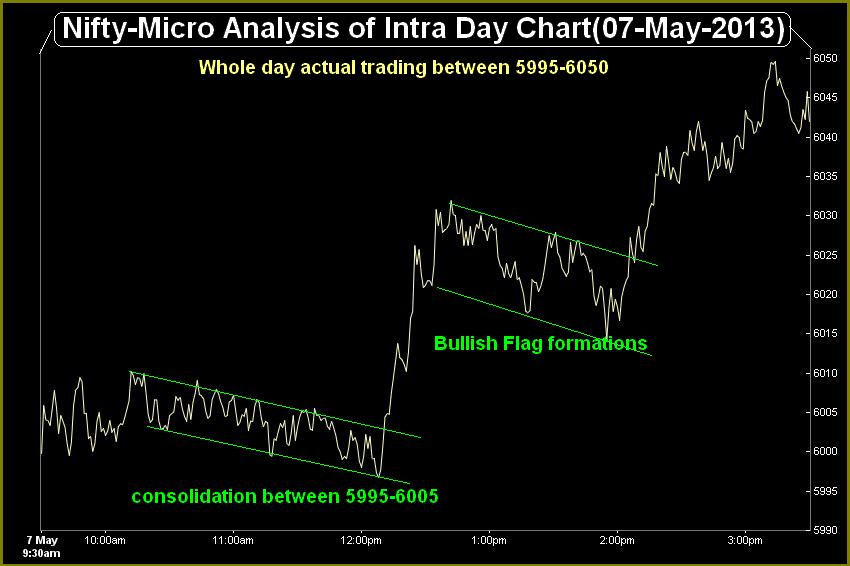
Nifty-Intra Day Chart (07-May-2013):-
 |
| Just click on chart for its enlarged view |
Technical Patterns and Formations in today intraday charts
1- First 3 hours lower levels consolidation between 5995-6005.
2- Bullish Flag formations.
3- Whole day actual trading between 5995-6050
Conclusions from intra day chart analysis
Sentiment is heated and indicators are over bought therefore intraday corrections can not be ruled out. As Many times Bullish markets completes correction in range bound mode or after higher levels consolidations also therefore only such type of minor corrections will be considered at this moment because no selling seen today and complete selling patterns are required for decisive down moves or deeper correction.
Although negative news flow form Parliament today but Indian markets showed whole day up moves after first 3 hours lower levels consolidations and Bullish Flag formations in the Mid session therefore rally continuation is expected in the coming sessions.
Next strong resistances are between 6050-6105 and market requires complete follow up consolidations for crossing and sustaining above it therefore slow up moves within this range and coming 1/2 sessions trading within it is possible. As no harm to on going rally yet therefore up moves will be seen within and above mentioned resistances range(6050-6105).
| FII trading activity on NSE and BSE in Capital Market Segment(In Rs. Crores) |
| Category | Date | Buy Value | Sell Value | Net Value |
| FII | 07-May-2013 | 3021.82 | 2366.61 | 655.21 |
|
|
| DII trading activity on NSE and BSE in Capital Market Segment(In Rs. Crores) |
| Category | Date | Buy Value | Sell Value | Net Value |
| DII | 07-May-2013 | 744.18 | 1473.35 | -729.17 | | |
Main features of today trading are as follows
Ratios
Index Options Put Call Ratio: 1.07
Total Options Put Call Ratio: 1.02
Nifty P/E Ratio(07-May-2013): 17.98
Advances & Declines
BSE Advances : 1,354
BSE Declines : 1,063
NSE Advances : 843
NSE Declines : 586
Nifty Open Interest Changed Today
Nifty- 5800 CE(May)- -181,550(-7.30%)
Nifty- 5800 PE(May)- 908,400(11.93%)
Nifty- 5900 CE(May)- -482,750(-9.45%)
Nifty- 5900 PE(May)- 1,116,150(20.94%)
Nifty- 6000 CE(May)- -518,000(-9.40%)
Nifty- 6000 PE(May)- 2,183,150(83.83%)
Nifty- 6100 CE(May)- -297,650(-5.58%)
Nifty- 6100 PE(May)- 337,450(40.31%)
Nifty- 6200 CE(May)- 1,745,150(45.10%)
Nifty- 6200 PE(May)- -14,350(-1.91%)
Closing
Sensex- closed at 19,888.95(215.31 Points & 1.09%)
Nifty- closed at 6,043.55(72.50 Points & 1.21 %)
CNX Midcap - closed at 8,039.65(70.75 Points & 0.89%)
CNX Smallcap- closed at 3,315.15(28.10 Points & 0.85%)
Nifty Spot-Levels
R3 6136
R2 6093
R1 6068
Avg 6025
S1 6000
S2 5957
S3 5932
Nifty Spot-Trading Strategy
H6 6111 Trgt 2
H5 6096 Trgt 1
H4 6080 Long breakout
H3 6061 Go Short
H2 6055
H1 6049
L1 6036
L2 6030
L3 6024 Long
L4 6005 Short Breakout
L5 5989 Trgt 1
L6 5974 Trgt 2
Nifty(May Fut)-Levels
R3 6148
R2 6102
R1 6076
Avg 6030
S1 6004
S2 5958
S3 5932
Nifty(May Fut)-Trading Strategy
H6 6122 Trgt 2
H5 6106 Trgt 1
H4 6089 Long breakout
H3 6069 Go Short
H2 6063
H1 6056
L1 6043
L2 6036
L3 6030 Long
L4 6010 Short Breakout
L5 5993 Trgt 1
L6 5977 Trgt 2
Bank Nifty(May Fut)-Levels
R3 12919
R2 12768
R1 12682
Avg 12531
S1 12445
S2 12294
S3 12208
Bank Nifty(May Fut)-Trading Strategy
H6 12837 Trgt 2
H5 12781 Trgt 1
H4 12726 Long breakout
H3 12661 Go Short
H2 12639
H1 12617
L1 12574
L2 12552
L3 12530 Long
L4 12465 Short Breakout
L5 12410 Trgt 1
L6 12354 Trgt 2
Neither Global cues are Bullish today nor News flow is positive today but Indian markets are more than 1.20% up therefore will be understood most strong. Nifty has cleared most of the resistances and now trading a little below the highest of on going rally after completing Short Term correction in narrow range moves.
As no sign of weakness yet therefore rally continuation is expected.
As busy in a marriage therefore only Mid-session Outlooks will be updated today and remaining all other features will be posted after 9:00 PM today.
Following line was told today in Technical Analysis,Research & Weekly Outlook (May 06 to May 10,2013)
Expected that Nifty will firstly hover around previous 2 Sessions actual trading range(5927-6017) and will prepare for next trend
As was told 100% same happened and today whole day trading was seen between 5,928.45-5,976.50 but intraday patterns are not showing any clear pattern formation because lower levels supports with some higher levels selling indications also seen.
It will be better to wait for one sided intraday patterns formations and valid break out of 5927-6017 should also be watched in the coming sessions for next moves confirmations. We tells only those words which are confirm and never try to guess therefore when Indian markets closed near the top of the day on 02-05-2013 then we told these lines on 02-05-2013 in Short Term Correction on Cards:-
Short Term Correction will be seen tomorrow despite whatsoever rates cuts by RBI.
Technical Analysis,Research & Weekly Outlook
(May 06 to May 10,2013)
Nifty-EOD Chart (03-May-2013):-
 |
| Just click on chart for its enlarged view |
Technical Patterns and Formations in EOD charts
1- 4531.15 on 20-12-2011(Wave-3 beginning after 13 Months Wave-2 correction completion)
2- Wave 1(5629.95 on 22-02-2012)
3- Wave 2(4770.35 on 04-06-2012)
4- Wave 3(6111.80 on 29-01-2013)
5- Wave 4(5477.20 on 10-04-2013)
6- Wave 5 continuation with top formation at 6019.45 on 02-May-2013.
Conclusions from EOD chart analysis
All trends are up after 542 points strong rally in 14 sessions but Short Term correction is due also because indicators are overbought.
Nifty-Intra Day Chart (May 02 and May 3,2013):-
 |
| Just click on chart for its enlarged view |
Technical Patterns and Formations in last 2 Sessions intraday charts
1- Good Selling between 5993-6017 on 02-05-2013
2- Selling between 5990-5999 on 03-05-2013
3- Minor Supports at lower levels between 5933-5957 on 03-05-2013
4- 2 Sessions actual trading between 5927-6017
Conclusions from 2 Sessions intra day chart analysis
Good selling at higher levels in both previous sessions and minor supports can not be ruled out at lower levels on 03-05-2013 because markets did not showed as such down moves after most disappointing RBI Credit policy as were required. As higher levels selling with lower levels supports also in last 2 sessions therefore mixed formations in both previous sessions.
Conclusions (After Putting All Studies Together)
Short Term correction is due and its first indication after good higher levels Selling on 02-05-2013. As minor Supports also seen at lower levels on 03-05-2013 therefore valid break out of last 2 Sessions actual trading between range(5927-6017) will be next decisive moves confirmation.
Expected that Nifty will firstly hover around previous 2 Sessions actual trading range(5927-6017) and will prepare for next trend after 14 sessions strong rally. As Bull markets does not correct deep and completes its correction between range bound moves therefore deeper correction will not be considered at this moment because only one day(02-05-2013) good selling.
Correction continuation and its length will be decided according to follow up moves in the coming couple of sessions. If follow up selling develops then following retracement levels will be firstly watched for correction completion:-
38.2%- 5811
50.0%- 5748
61.8%- 5684
Impulsive Wave 5 continuation after and now its corrective Sub Wave ii is being considered after good selling on 02-05-2013 and beginning of down moves on 03-05-2013. Expected that Wave 5 will remain continued after on going correction completion and follow up consolidations. Let it happen then impulsive Sub Wave iii of Wave 5 will begin to form new highs above 6111 and its confirmation will be after sustaining above 6019.
| FII trading activity on NSE and BSE in Capital Market Segment(In Rs. Crores) |
| Category | Date | Buy Value | Sell Value | Net Value |
| FII | 03-May-2013 | 2903.75 | 1949.8 | 953.95 |
|
|
| DII trading activity on NSE and BSE in Capital Market Segment(In Rs. Crores) |
| Category | Date | Buy Value | Sell Value | Net Value |
| DII | 03-May-2013 | 886.12 | 1678.9 | -792.78 |
|
|
Main features of today trading are as follows
Ratios
Index Options Put Call Ratio: 1.07
Total Options Put Call Ratio: 1.02
Nifty P/E Ratio(06-May-2013): 17.75
Advances & Declines
BSE Advances : 1,030
BSE Declines : 1,336
NSE Advances : 511
NSE Declines : 807
Nifty Open Interest Changed Today
Nifty- 5700 CE(May)- -46,250(-2.44%)
Nifty- 5700 PE(May)- 554,350(8.06%)
Nifty- 5800 CE(May)- -130,050(-4.96%)
Nifty- 5800 PE(May)- 898,850(13.70%)
Nifty- 5900 CE(May)- -285,200(-5.22%)
Nifty- 5900 PE(May)- -257,150(-4.59%)
Nifty- 6000 CE(May)- 695,150(13.27%)
Nifty- 6000 PE(May)- -34,750(-1.40%)
Nifty- 6100 CE(May)- 497,950(9.79%)
Nifty- 6100 PE(May)- 201,150(33.39%)
Closing
Sensex- closed at 19,575.64(-160.13 Points & -0.81%)
Nifty- closed at 5,944.00(-55.35 Points & -0.92%)
CNX Midcap - closed at 7,897.10(-16.00 Points & -0.20%)
CNX Smallcap- closed at 3,237.65(-18.30 Points & -0.56%)
Nifty Spot-Levels
R3 6056
R2 6028
R1 5986
Avg 5958
S1 5916
S2 5888
S3 5846
Nifty Spot-Trading Strategy
H6 6014 Trgt 2
H5 5998 Trgt 1
H4 5982 Long breakout
H3 5963 Go Short
H2 5956
H1 5950
L1 5937
L2 5931
L3 5924 Long
L4 5905 Short Breakout
L5 5889 Trgt 1
L6 5873 Trgt 2
Nifty(May Fut)-Levels
R3 6059
R2 6032
R1 5990
Avg 5963
S1 5921
S2 5894
S3 5852
Nifty(May Fut)-Trading Strategy
H6 6017 Trgt 2
H5 6001 Trgt 1
H4 5985 Long breakout
H3 5966 Go Short
H2 5960
H1 5954
L1 5941
L2 5935
L3 5929 Long
L4 5910 Short Breakout
L5 5894 Trgt 1
L6 5878 Trgt 2
Bank Nifty(May Fut)-Levels
R3 12893
R2 12771
R1 12554
Avg 12432
S1 12215
S2 12093
S3 11876
Bank Nifty(May Fut)-Trading Strategy
H6 12676 Trgt 2
H5 12600 Trgt 1
H4 12523 Long breakout
H3 12430 Go Short
H2 12399
H1 12368
L1 12305
L2 12274
L3 12243 Long
L4 12150 Short Breakout
L5 12073 Trgt 1
L6 11997 Trgt 2
Nifty Spot-Weekly Levels
R3 6170
R2 6094
R1 6019
Avg 5943
S1 5868
S2 5792
S3 5717
Nifty Spot-Weekly Trading Strategy
H6 6096 Trgt 2
H5 6062 Trgt 1
H4 6027 Long breakout
H3 5985 Go Short
H2 5971
H1 5957
L1 5930
L2 5916
L3 5902 Long
L4 5860 Short Breakout
L5 5826 Trgt 1
L6 5791 Trgt 2
Bank Nifty Spot-Weekly Levels
R3 13081
R2 12932
R1 12662
Avg 12513
S1 12243
S2 12094
S3 11824
Bank Nifty Spot-Weekly Trading Strategy
H6 12812 Trgt 2
H5 12718 Trgt 1
H4 12623 Long breakout
H3 12508 Go Short
H2 12469
H1 12431
L1 12354
L2 12316
L3 12277 Long
L4 12162 Short Breakout
L5 12067 Trgt 1
L6 11973 Trgt 2
Blog will be updated before 11 am today.
| | | |