Watch 7 levels for deeper correction beginning confirmations
Technical Analysis,Research & Weekly Outlook
(Aug 31 to Sep 03,2020)
Nifty-EOD Chart Analysis
(Wave B structure & Stochastics)
Nifty-EOD Chart (28-Aug-2020):-

Technical Patterns and Formations in EOD charts
1- Corrective Wave-A completion at 7511.10 on 24-03-2020 and Wave-B beginning
2- Wave-a of Wave-B(9889.05 on 30-04-2020)
3- Wave-b of Wave-B(8806.75 on 16-05-2020)
4- Wave-c of Wave-B continuation with recent top formation at 11686.00 on 28-08-2020
5- Stochastic-%K(5) is at 86.26 & %D(3) is at 85.44
6- Stochastic is showing negative divergence in Overbought zone
Conclusions from EOD chart analysis
(Wave B structure & Stochastics)
Wave-A of "ABC correction" completed at 7511.10 on 24-03-2020 and Wave-B started which is in continuation with recent top formation at 11686.00 on 28-08-2020 and no confirmation of its completion yet.
As Short Term indicator has turned Overbought therefore emergence of Short Term correction expectations which may begin in the next week/weeks.
Nifty-EOD Chart Analysis
(Trendline & Average)
Nifty-EOD Chart (28-Aug-2020):-

Technical Patterns and Formations in EOD charts
1- Corrective Wave-A completion at 7511.10 on 24-03-2020 and Wave-B beginning
2- Wave-B continuation with recent top formation at 11686.00 on 28-08-2020
3- Wave-B Trend line at 11470
4- Long Term Trend decider 200-Day SMA is today at 10819
Conclusions from EOD chart analysis
(Trendline & Average)
As indicators are Overbought therefore correction is expected hence firstly Wave-B Trend line(11470) and Long Term Trend decider 200-Day SMA(today at 10819) should be firstly watched in the coming week/weeks for the life of expected correction.
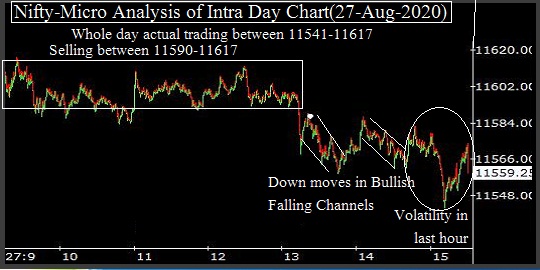
Nifty-Intra Day Chart Analysis
(28-Aug-2020)
Nifty-Intra Day Chart (28-Aug-2020):-

Technical Patterns formation in today intraday charts
1- Whole day Up moves in Bearish Rising Channels
2- Whole day Down moves in Bullish Falling Channels
3- Whole day actual trading between 11590-11686
Conclusions from intra day chart analysis
Although whole day positive zone trading but only volatility was seen. As selling developed through Whole day Up moves in Bearish Rising Channels and buying was seen through Whole day Down moves in Bullish Falling Channels therefore last Friday trading will be understood Mixed Patterns formation between 11590-11686
Expected that Nifty will firstly trade and prepare for next moves within last Friday trading range(11590-11686) and finally sustaining it beyond will confirm next decisive moves which should be firstly watched in the beginning of coming week.
Conclusions
(After Putting All Studies Together)
1- Long term trend is up.
2- Intermediate term trend is up.
3- Short term trend is up.
Wave-B continuation and no confirmation of its completion yet but Short Term Indicator Stochastics has turned Overbought therefore Short Term correction is expected which may begin any day.
As sufficient selling patterns have not been seen in previous week therefore until complete selling patterns will not develop on EOD and Intraday charts till then deeper down moves will not be seen.
Both intraday buying and selling was seen between 11590-11686 last Friday therefore sustaining beyond this range should be firstly watched in the beginning of next week and next supports below 11590 are as follows:-
1- 11541-11563
2- 11462-11494
3- 11427-11446
4- 11375-11394
5- 11290-11330
As Wave-B is more than 5 months old therefore generating a signal of Wave-B time-wise completion. Weekly Stochastics is also showing negative divergence in Overbought zone hence suggesting that Wave-B is well riped for correction which may be deeper also. Life and size of correction will be decided by following 2 Crucial levels:-
1- Wave-B Trend line at 11470.
2- Long Term Trend decider 200-Day SMA is today at 10819.
As Wave-B is well matured for completion and Wave-C beginning towards and below the origin level of Wave-B(7511.10) therefore above mentioned 7 levels(2 Crucial levels and 5 supports) should be watched for Wave-B completion and deeper correction beginning confirmations.