ॐ ह्रीं श्रीं लक्ष्मीभयो नमः॥


Trading "calls" from our "Software" with more than "90% accuracy"

More than "12 years" old "only site of whole world" 
with more than "9700 accurate Outlooks" of 
"Indian Stock Markets" 

Nifty-Micro Analysis of Intra Day Chart For 18-07-2011

Nifty-Intra Day Chart(15-Jul-2011):-
Just click on chart for its enlarged view
Technical Patterns and Formations in today intraday charts

1- Condolidation between- 5566-5580
2- Most of the time between 29 points range within 5566-5595

Conclusions

As consolidation patterns seen at lower levels within most of the trading range  today therefore upmoves are expected in the coming sessions.

Indian Stock Markets Closing Reports(15-Jul-2011)


Main features of today trading are as follows

1- Narrow range market today.
2- All the Indices closed almost flat but most in Red.
3- Most of the Indices are showing consolidation patterns.

Ratios

Nifty Put Call Ratio: 1.02
Nifty P/E Ratio(15-Jul-2011): 20.45

Advances & Declines

BSE ADVANCES : 1355
BSE DECLINES : 1514
NSE ADVANCES :  608
NSE DECLINES :  804

Nifty Open Interest Changed Today

Nifty- 5500 CE(Jul)- +240950(+5.91%)
Nifty- 5500 PE(Jul)- +226850(+2.28%)

Nifty- 5600 CE(Jul)- +1228900(+18.72%)
Nifty- 5600 PE(Jul)- +720450(+11.89%)

Closing 

Nifty- closed at 5,581.10(-18.70 Points & -0.33%)
Sensex- closed at 18,561.92(-56.28 Points & -0.30% )
CNX MIDCAP - closed at 8,173.65(+6.80 Points & +0.08%)
BSE SMALL CAP- closed at 8,363.22(+6.83 Points & +6.83%)

FII Trading Data in Derivatives Segment on 15-Jul-2011

FII & DII trading activity in Capital Market Segment on 15-Jul-2011

FII trading activity on NSE and BSE in Capital Julket Segment(In Rs. Crores)
CategoryDateBuy ValueSell ValueNet Value
FII15-Jul-20111647.521574.4973.03


DII trading activity on NSE and BSE in Capital Julket Segment(In Rs. Crores)
CategoryDateBuy ValueSell ValueNet Value
DII15-Jul-2011687.05726.19-39.14

Nifty Spot-Levels & Trading Strategy for 18-07-2011

Nifty Spot-Levels
R3 5689.67
R2 5660.33
R1 5620.67
PIVOT 5591.33
S1 5551.67
S2 5522.33
S3 5482.67

Nifty Spot-Trading Strategy

H6 5650     Trgt 2
H5 5634     Trgt 1
H4 5618     Long breakout
H3 5599     Go Short
H2 5593
H1 5587
L1 5574
L2 5568
L3 5562     Long
L4 5543    Short Breakout
L5 5527     Trgt 1
L6 5511     Trgt 2

Nifty(Jul Fut)-Levels & Trading Strategy for 18-07-2011


Nifty(Jul Fut)-Levels

R3 5706.67
R2 5673.33
R1 5629.67
PIVOT 5596.33
S1 5552.67
S2 5519.33
S3 5475.67

Nifty(Jul Fut)-Trading Strategy

H6 5663    Trgt 2
H5 5645    Trgt 1
H4 5628    Long breakout
H3 5607    Go Short
H2 5600
H1 5593
L1 5578
L2 5571
L3 5564     Long
L4 5543     Short Breakout
L5 5526     Trgt 1
L6 5508     Trgt 2

Bank Nifty(Jul Fut)-Levels & Trading Strategy for 18-07-2011


Bank Nifty(Jul Fut)-Levels

R3 11487.33
R2 11422.67
R1 11334.33
PIVOT 11269.67
S1 11181.33
S2 11116.67
S3 11028.33

Bank Nifty(Jul Fut)-Trading Strategy

H6 11399     Trgt 2
H5 11364     Trgt 1
H4 11330     Long breakout
H3 11288     Go Short
H2 11274
H1 11260
L1 11231
L2 11217
L3 11203     Long
L4 11161     Short Breakout
L5 11127     Trgt 1
L6 11092     Trgt 2

Nifty Spot-Weekly Levels & Trading Strategy(Jul 18 to Jul 22,2011)


Nifty Spot-Weekly Levels

R3 5814.67
R2 5734.33
R1 5657.67
PIVOT 5577.33
S1 5500.67
S2 5420.33
S3 5343.67

Nifty Spot-Weekly Trading Strategy 

H6 5740     Trgt 2
H5 5703     Trgt 1
H4 5667     Long breakout
H3 5624     Go Short
H2 5609
H1 5595
L1 5566
L2 5552
L3 5537     Long
L4 5494     Short Breakout
L5 5458     Trgt 1
L6 5421     Trgt 2

NIFTY-JUL F&O-1ST BUYING OF 15-07-2011-TRADE

NIFTY(JUL FUT-BUY-POSITIONAL)SL-5554-TGT-5644-CMP-5588

NIFTY(JUL CALL OPTION-BUY-POSITIONAL)SL-5554-TGT-5644-S.P.FOR CALL-5500,5600(JUL FUT-RATES FOR ALL OPTIONS)-CMP-5588

Pre-closing Outlook(15-07-2011)

Follwing line was told in Technical Analysis and Research & Market Outlook(15-07-2011) today:-

Quiet markets expected near 5600 and firstly trading between 5570-5625 and Nifty traded most of the time between 29 points range within 5566-5595 with lower levels consolidation indications. and next trend confirmation range is sustaining beyond 5566-5595

Mid-session Outlook(15-07-2011)

Market could not sustain at higher levels after positive opening and trading between 5566-5590 for the last 2 hours with mixed patterns and signals. Mentioned intraday range of today will give next moves first indication.

Technical Analysis and Research & Market Outlook(15-07-2011)

Technical Analysis and Research of Micro Analysis of Nifty Intra Day Charts already been explained in following topic with 1 chart therefore not being repeated:-

Nifty-Micro Analysis of Intra Day Chart For 15-07-2011

Daily Indicators & Averages Analysis Chart(14-07-2011):-
Just click on chart for its enlarged view

Conclusions

1- Averages(EMA-8,21,55,200)- All the averages are between 5551-5600.
2- Bollinger Band- Nifty is moving around its middle line for the last 3 sessions and showing no direction.
3- MACD- Both lines are kissing and not confirming any trend.
4- ROC- Resting at zero line and not confirming any direction.
5- RSI- At equalibrium line and not confirming any direction.
6- Slow Stochastic- At oversold line and not suggesting any immediate very short termbig move.
6- William %R- Near equalibrium line and not suggesting any immediate very short termbig move.

Conclusions (From Daily Indicators & Averages Analysis)

Direction less market and Indian market will prepare for next moves in the coming sessions.

Conclusions (After Putting All Studies Together)

All the trends are also side ways and Indian markets are trying to find direction through hovering around 200 Day EMA(5582) for the last 3 sessions and all the crucial averages are also between 5551-5600.

Nifty is trading between 5496-5470 for the last 13 sessions with good support between 5500-5580 and 2 resistances between(5620-5655 & 5700-5725). Nifty will trade first between 5570-5625 and next moves frist confirmation range is 5540-5655.

Quiet markets expected near 5600 and firstly trading between 5570-5625 today and Indian markets will try to find direction within this range and next moves first indication will be sustaining beyond this range.

Nifty-Micro Analysis of Intra Day Chart For 15-07-2011

Nifty-Intra Day Chart(14-Jul-2011):
Just click on chart for its enlarged view
Technical Patterns and Formations in today intra day charts:-

1- Condolidation between- 5542-5565
2- Condolidation between- 5580-5590
3- Mixed Patterns between- 5630-5653

Conclusions

Good consolidation at lower levels but Indian markets slipped sharply from higher levels after last 2 hours range bound moves between 5620-5653,intraday patterns within this range are mixed and short covering possibility within this range can not be ruled out.

Confirm consolidation at lower levels but mixed patterns at higher levels therefore Nifty will trade within today range(5542-5653) tomorrow and prepare for next moves and follow up buying/selling tomorrow will give next move indication.

Indian Stock Markets Closing Reports(14-Jul-2011)


Main features of today trading are as follows

1- White Candle.
2- Mixed closing. Indices closed from from flat to Red and Green.
3- Volatile market.

Ratios

Nifty Put Call Ratio: 1.03
Nifty P/E Ratio(14-Jul-2011): 20.55

Advances & Declines

BSE ADVANCES : 1614
BSE DECLINES : 1233
NSE ADVANCES : 837
NSE DECLINES : 579

Nifty Open Interest Changed Today

Nifty- 5500 CE(Jul)- -264250(-6.09%)
Nifty- 5500 PE(Jul)- +267150(+2.69%)

Nifty- 5600 CE(Jul)- +432900(+7.13%)
Nifty- 5600 PE(Jul)- +802950(+14.89%)

Nifty- 5700 CE(Jul)- +262250(+3.19%)
Nifty- 5700 PE(Jul)- +974850(+37.45%)

Closing 

Nifty- closed at 5,599.80(+ 14.35 Points & +0.26%)
Sensex- closed at18,618.20(+22.18 Points & +0.12%)
CNX MIDCAP - closed at8,168.40(+65.40 Points & +0.81%)
BSE SMALL CAP- closed at  8,356.39(+14.67 Points & + 0.18%)

FII Trading Data in Derivatives Segment on 14-Jul-2011

FII & DII trading activity in Capital Market Segment on 14-Jul-2011

FII trading activity on NSE and BSE in Capital Julket Segment(In Rs. Crores)
CategoryDateBuy ValueSell ValueNet Value
FII14-Jul-20112339.992128.53211.46


DII trading activity on NSE and BSE in Capital Julket Segment(In Rs. Crores)
CategoryDateBuy ValueSell ValueNet Value
DII14-Jul-20111591.71073.88517.82

Nifty Spot-Levels & Trading Strategy for 15-07-2011


Nifty Spot-Levels

R3 5766
R2 5709
R1 5654
Avg 5597
S1 5542
S2 5485
S3 5430

Nifty Spot-Trading Strategy

H6 5712     Trgt 2
H5 5686     Trgt 1
H4 5660     Long breakout
H3 5629     Go Short
H2 5619
H1 5609
L1 5588
L2 5578
L3 5568     Long
L4 5537     Short Breakout
L5 5511     Trgt 1
L6 5485     Trgt 2

Nifty(Jul Fut)-Levels & Trading Strategy for 15-07-2011


Nifty(Jul Fut)-Levels

R3 5783
R2 5725
R1 5662
Avg 5604
S1 5541
S2 5483
S3 5420

Nifty(Jul Fut)-Trading Strategy

H6 5722     Trgt 2
H5 5694     Trgt 1
H4 5666     Long breakout
H3 5633     Go Short
H2 5622
H1 5611
L1 5588
L2 5577
L3 5566     Long
L4 5533     Short Breakout
L5 5505     Trgt 1
L6 5477     Trgt 2

Bank Nifty(Jul Fut)-Levels & Trading Strategy for 15-07-2011

Bank Nifty(Jul Fut)-Levels

R3 11721
R2 11563
R1 11419
Avg 11261
S1 11117
S2 10959
S3 10815

Bank Nifty(Jul Fut)-Trading Strategy

H6 11582     Trgt 2
H5 11512     Trgt 1
H4 11442     Long breakout
H3 11359     Go Short
H2 11331
H1 11303
L1 11248
L2 11220
L3 11192     Long
L4 11109     Short Breakout
L5 11039     Trgt 1
L6 10969     Trgt 2

Pre-closing Outlook-2(14-07-2011)

Last 2 hours trading between 5620-5653 but Nifty could not sustained at higher levels within this range therefore this range will be firstly watched for next up moves confirmations because short covering possibility within this range can not be ruled out.

Pre-closing Outlook(14-07-2011)

When  SGX Nifty WAS trading 45 points down then we told following lines in Market Outlook(14-07-2011):-

"expected that Indian markets wil again  consolidate today and Indian markets will finally close flat to Green today"

We told following lines for Indian markets reaction on Mumbai serial Blasts

1-"Indian markets will not be affected from these serial Blasts"

We were cautious but confident for upmoves because yesterday intraday consolidations between 5557-5575. Nifty cleared all the resistances and next immediate resistance is above 5700 and its testing is expected now.

Mid-session Outlook(14-07-2011)

When Indian markets were trading near today's lows then lines were told in Post-open Outlook(14-07-2011):-

As good consolidation between 5557-5575 yesterday therefore sustaining below is must and will be watched also today for next down moves confirmations despite Mumbai blasts.

Nifty recovered and trading above after intraday support between 5542-5550 and intraday patterns are suggesting consolidations. Next moves confirmation range is sustaining beyond 5542-5575 and outlook is positive despite Red trading since morning today.

Post-open Outlook(14-07-2011)

It was expected that Indian markets will not adversely react Mumbai seraial blasts but clear nervousness seen today. Indian markets under performing global markets due to blasts and Nifty slipped below yesterday consolidation range lowest of 5557.

Nifty sustaining below 5557 will mean more down moves and sharp declines because that will be confirmation of all trends turning down. As good consolidation between 5557-5575 yesterday therefore sustaining below is must and will be watched also today for next down moves confirmations despite Mumbai blasts.

Market Outlook(14-07-2011)

US markets closed positive but slipped frrm higher levels yesterday and US futures is in Red since morning today therefore sentiment is depressed and some Asian markets are trading weak. Sentiment is subdued due to Mumbai serial blasts also therefore flat to Red opening is possible in Indian markets but Good intraday support between 5557-5575 yesterday.

As far as Indian stock Markets reactions on Mumbai Blasts are concerned that Indian markets will not be affected from these serial Blasts and Nifty will not slip below 5557 in whatsoever worse situation. Whole day good consolidation between 5557-5575 yesterday and Nifty will finally sustain above 5557. Although SGX Nifty is trading 45 points down at this moment but expected that Indian markets wil again  consolidate today and Indian markets will finally close flat to Green today.

Nifty-Micro Analysis of Intra Day Chart For 14-07-2011

Nifty-Intra Day Chart(13-Jul-2011):-
Just click on chart for its enlarged view
Technical Patterns and Formations in today intraday charts

1- Condolidation between- 5557-5575

Conclusions

Market consolidated whole day therefore following lines were told in Pre-closing Outlook(13-07-2011)

1-intraday patterns are showing consolidation today as well as possibility of sustaining above 5578 is higher also
2- confirmation is must through sustaining above 5578 or forceful up move above 5578 because global markets pressure is high nowadays.

Nifty tested 5500 yesterday due to crashing Global markets but Indian markets consolidated today and Nifty sustaining above 5628 will be next up moves strong indication and it is expected also after today whole day consolidations.

Indian Stock Markets Closing Reports(13-Jul-2011)

Main features of today trading are as follows

1- Long White Candle.
2- All the indices closed in Green.
3- Good support at lower levels today.

Ratios

Nifty Put Call Ratio: 0.99
Nifty P/E Ratio(13-07-2011): 20.51

Advances & Declines

BSE ADVANCES : 1848
BSE DECLINES : 1055
NSE ADVANCES : 1034
NSE DECLINES : 373

Nifty Open Interest Changed Today

Nifty- 5500 CE(Jul)- -515150(-10.61%)
Nifty- 5500 PE(Jul)- +1683900(+19.92%)

Nifty- 5600 CE(Jul)- +9600(+0.15%)
Nifty- 5600 PE(Jul)- +964900(+21.80.00%)

Nifty- 5700 CE(Jul)- +497550(+6.42%)
Nifty- 5700 PE(Jul)- +102000(+4.08.00%)

Closing 

Nifty- closed at 5,585.45(+59.30 Points & +1.07%)
Sensex- closed at 18,596.02(+184.40 Points & +1.00% )
CNX MIDCAP - closed at 8,103.00(+98.40 Points & +1.23%)
BSE SMALL CAP- closed at 8,341.72(+79.90 Points & +0.97%)

FII & DII trading activity in Capital Market Segment on 13-Jul-2011

FII trading activity on NSE and BSE in Capital Julket Segment(In Rs. Crores)
CategoryDateBuy ValueSell ValueNet Value
FII13-Jul-20112387.522071.57315.95


DII trading activity on NSE and BSE in Capital Julket Segment(In Rs. Crores)
CategoryDateBuy ValueSell ValueNet Value
DII13-Jul-2011963.381332.29-368.91

Nifty(Jul Fut)-Levels & Trading Strategy for 14-07-2011

Nifty(Jul Fut)-Levels

R3 5681
R2 5645
R1 5622
Avg 5586
S1 5563
S2 5527
S3 5504

Nifty(Jul Fut)-Trading Strategy

H6 5658   Trgt 2
H5 5644   Trgt 1
H4 5631   Long breakout
H3 5615   Go Short
H2 5609
H1 5604
L1 5593
L2 5588
L3 5582    Long
L4 5566    Short Breakout
L5 5553    Trgt 1
L6 5539    Trgt 2

Bank Nifty(Jul Fut)-Levels & Trading Strategy for 14-07-2011

Bank Nifty(Jul Fut)-Levels

R3 11327
R2 11262
R1 11216
Avg 11151
S1 11105
S2 11040
S3 10994

Bank Nifty(Jul Fut)-Trading Strategy

H6 11281     Trgt 2
H5 11256     Trgt 1
H4 11231     Long breakout
H3 11200     Go Short
H2 11190
H1 11180
L1 11159
L2 11149
L3 11139    Long
L4 11108   Short Breakout
L5 11083   Trgt 1
L6 11058   Trgt 2

Nifty Spot-Levels & Trading Strategy for 14-07-2011

Nifty Spot-Levels

R3 5662
R2 5629
R1 5607
Avg 5574
S1 5552
S2 5519
S3 5497`

Nifty Spot-Trading Strategy

H6 5640     Trgt 2
H5 5627     Trgt 1
H4 5615     Long breakout
H3 5600     Go Short
H2 5595
H1 5590
L1 5579
L2 5574
L3 5569    Long
L4 5554    Short Breakout
L5 5542    Trgt 1
L6 5529.   Trgt 2

Pre-closing Outlook(13-07-2011)

Following lines were told within first 45 minutes today in Post-open Outlook

1- Nifty will trade now between yesterday selling range (5550-5578) and prepare for next moves. Coming hours trading patterns (consolidation/distribution) will give next moves first signal.

2- Next moves and trend confirmation will be sustaining beyond 5550-5578.

Nifty traded whole day within mentioned very small range and intraday patterns are showing consolidation today as well as possibility of sustaining above 5578 is higher also but confirmation is must through sustaining above 5578 or forceful up move above 5578 because global markets pressure is high nowadays.

Post-open Outlook(13-07-2011)

Yesterday down moves were the result of crashing global markets and Indian markets are trading strong after getting positive Asian cues. Nifty has almost crossed yesterday selling range(5550-5578) within first 25 minutes of trading and made high at 5578.90. It is sign of strength but Nifty will trade now between yesterday selling range (5550-5578) and prepare for next moves. Coming hours trading patterns (consolidation/distribution) will give next moves first signal. Next moves and trend confirmation will be sustaining beyond 5550-5578.

Technical Analysis,Researches & Market Outlook(13-07-2011)

Global storm and weaker IIP data reaction was so heavy yesterday that Nifty traded whole day below 200 Day EMA(5582) after gap down opening and followed global trend through deep Red closing. Nifty traded 8 days above between 5602-5738 and re-entered into last 39 sessions range(5329-5604) yesterday and Indian markets again turned into range bound mode within following 2 ranges:-

1- 5329-5628
2- 5178-5738

Nifty-Micro Analysis of Intra Day Chart For 13-07-2011

Nifty-Intra Day Chart(12-Jul-2011):-
Just click on chart for its enlarged view
Technical Patterns and Formations in intraday charts

1- Selling between- 5550-5578
2- Mixed Patterns between- 5500-5538

Conclusions (After Putting All Studies Together)

As intraday selling below 5600 yesterday therefore Nifty requires complete consolidation for crossing 5600. Correction is on and follow up selling today will mean more down moves.  Nifty will first trade between 5500-5538 and follow up buying/selling between this range will give next moves first indication.

Next trading range is 5500-5578 and next moves confirmation will be sustaining beyond this range.Nifty will trade first between 5500-5538 today and crossing of this range will be first indication of next moves.

Trading between 5500-5538 will be watched first and conclusions will be updated in Mid-session Outlooks according to next moves confirmations.
Blog could not be updated today due to some personal emergencies. Services will be resumed again as early as possible and certainly before tomorrow markets opening.

Crashing Global Markets Vs Supports at 5600 & 200 Day EMA


Market Outlook(12-07-2011)

Technical Analysis and Research of EOD and weekly charts,Micro Analysis of Nifty Intra Day Chart,Technical Positions,next possibilities have already been explained in following topics with 2 Charts therefore not being repeated:-

1- Nifty-Micro Analysis of Intra Day Chart For 12-07-2011
2- Rally after correction & Consolidation between 5610-5700
3- 2 Bullish Formations in EOD Charts
4- Nifty-Waves Structure From Jan 2008 Crash & Strength of Indian markets


Conclusions (After Putting All Studies Together)


Correction was expected and it was told also in all the outlooks which were updated for yesterday and this week. 5606-5628 had been strong support and and Nifty traded within this range more than 3 hours with intraday consolidation patterns yesterday. US markets are sharp down and Dow Jones is trading more than 180 points down and such weak closing will hamper the sentiment today morning and Red zone opening below 5600 possibility can not be ruled out but sustaining beyond 5600 will be strong indication of next trend.

Whatsoever may be bearish global cues but 5600 is strong support and and until Nifty will not sustain below 200 Day EMA(5582) till then view will not be bearish. Indian markets are in corrective mode and global markets are tanking therefore more weakness may be seen but firstly sustaining beyond 5600 and after that 200 Day EMA(5582) should be watched for next immediate moves confirmation.

As consolidation yesterday therefore finally up moves after more consolidations between 5582-5628 expected and sustaining beyond this range will be next moves confirmations.

Nifty-Micro Analysis of Intra Day Chart For 12-07-2011

Nifty-Intra Day Chart(11-Jul-2011):-
Just click on chart for its enlarged view
Technical Patterns and Formations in today intraday charts:-

1- Condolidation between 5602-5604
2- Falling Wedge(Bullish) Pattern Formation

Conclusions

Intraday support and consolidation at lower levels today. As all the global markets closed deep Red today therefore sharp correction seen but Nifty closed above 5610 on expected lines and again consolidated between previous support range of 5606-5628.

Dow Jones is more than 175 points down at this moment and such weak closing will mean possibility of trading below 5600 tomorrow and sustaining beyond 5600 be first watched tomorrow for next moves confirmation.

FII Trading Data in Derivatives Segment on 11-Jul-2011

FII & DII trading activity in Capital Market Segment on 11-Jul-2011

FII trading activity on NSE and BSE in Capital Julket Segment(In Rs. Crores)
CategoryDateBuy ValueSell ValueNet Value
FII11-Jul-20111889.741456.79432.95


DII trading activity on NSE and BSE in Capital Julket Segment(In Rs. Crores)
CategoryDateBuy ValueSell ValueNet Value
DII11-Jul-2011736.35662.7173.64

Indian Stock Markets Closing Reports(11-Jul-2011)

Main features of today trading are as follows

1- Black Candle.
2- Nifty got support at 5600 again
3- Most of the Indices in Red.

Ratios

Nifty Put Call Ratio: 0.99
Nifty P/E Ratio(12-07-2011): 20.67 

Advances & Declines

BSE ADVANCES : 1235
BSE DECLINES : 1631
NSE ADVANCES :  529
NSE DECLINES :  858

Nifty Open Interest Changed Today

Nifty- 5600 CE(Jul)- +113150(+2.26%)
Nifty- 5600 PE(Jul)- -526550(-8.35%)

Nifty- 5700 CE(Jul)- +1155900(+17.66%)
Nifty- 5700 PE(Jul)- -270450 (-7.54%)

Closing 

Nifty- closed at 5,616.10(-44.55 Points & -0.79%)
Sensex- closed at 18,721.39(-136.65 Points & -0.72% )
CNX MIDCAP - closed at 8,097.70(-18.20 Points & -0.22%)
BSE SMALL CAP- closed at 8,339.88(-35.26 Points & -0.42%)

Nifty Spot-Levels & Trading Strategy for 12-07-2011

Nifty Spot-Levels

R3 5696
R2 5674
R1 5645
Avg 5623
S1 5594
S2 5572
S3 5543

Nifty Spot-Trading Strategy

H6 5667     Trgt 2
H5 5655     Trgt 1
H4 5644     Long breakout
H3 5630     Go Short
H2 5625
H1 5620
L1 5611
L2 5606
L3 5601     Long
L4 5587     Short Breakout
L5 5576     Trgt 1
L6 5564     Trgt 2

Nifty(Jul Fut)-Levels & Trading Strategy for 12-07-2011

Nifty(Jul Fut)-Levels

R3 5703
R2 5681
R1 5649
Avg 5627
S1 5595
S2 5573
S3 5541

Nifty(Jul Fut)-Trading Strategy

H6 5671     Trgt 2
H5 5658     Trgt 1
H4 5646     Long breakout
H3 5631     Go Short
H2 5626
H1 5621
L1 5612
L2 5607
L3 5602     Long
L4 5587     Short Breakout
L5 5575     Trgt 1
L6 5562     Trgt 2

Bank Nifty(Jul Fut)-Levels & Trading Strategy for 12-07-2011

Bank Nifty(Jul Fut)-Levels

R3 11423
R2 11359
R1 11249
Avg 11185
S1 11075
S2 11011
S3 10901

Bank Nifty(Jul Fut)-Trading Strategy

H6 11314     Trgt 2
H5 11275     Trgt 1
H4 11235     Long breakout
H3 11187    Go Short
H2 11171
H1 11155
L1 11124
L2 11108
L3 11092    Long
L4 11044     Short Breakout
L5 11005    Trgt 1
L6 10965    Trgt 2

Pre-closing Outlook(11-07-2011)

Correction was expected and also told 2/3 times in previous outlooks. As sentiment was depressed due to global markets weakness therefore little deeper correction was seen today. Nifty traded within 5602-5652 with intraday consolidation patterns today therefore expected that finally up moves above 5652 are expected in the coming sessions.

Mid-session Outlook-2 (11-07-2011)

US Futures is trading 65 points down and all the global markets are trading or closed in Red except SSE Composite Index. Strong support between 5606-5628 and Nifty is trading between this range for the last one hour. Break out of this range will decide next Indian markets. As intraday pattterns are showing consolidations therefore finally up moves are expected.

Mid-session Outlook(11-07-2011)

All the Asian markets are in Red and Dow'futures is trading 47 points down therefore sentiment is depressed since morning today and Indian markets are down and also slipped form intraday higher levels.

Intraday patterns of are mixed and  first 3 hours trading range(5622-5652) will be watched for next moves confirmations.

Rally after correction & Consolidation between 5610-5700

Weekly Outlook(Jul 11 to Jul 15,2011)

Technical Analysis and Research of EOD charts,Micro Analysis of Nifty Intra Day Chart,Technical Positions,next possibilities have already been explained in following topics with 3 Charts therefore not being repeated:-

1- 
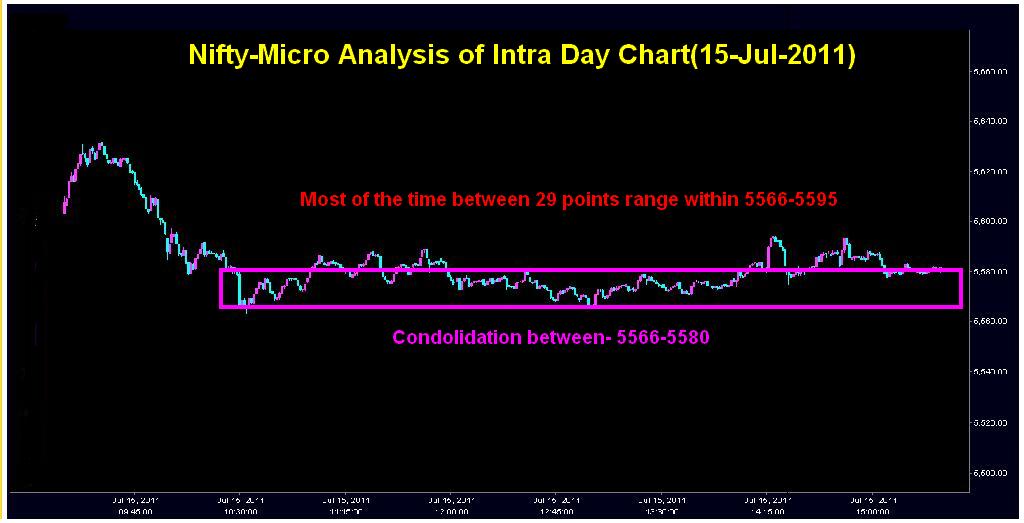
Nifty-Micro Analysis of Intra Day Chart For 11-07-2011
2- Nifty-Waves Structure From Jan 2008 Crash & Strength of Indian markets
3- 2 Bullish Formations in EOD Charts

Nifty-EOD Chart(08-Jul-2011):-
Just click on chart for its enlarged view
Technical Patterns and Formations in EOD charts

1- Wave-4 completed correction in 'ABC' Pattern.
2- Impulsive Wave-5 is on.
3- Resistance at 200-Day SMA(5742)
4- Support above 200-Day EMA(5582)
5- Resistance at Falling Trend line last Friday.
6- 200-Day SMA is above Falling Trend line.  


Conclusions 

Immediate Supports and Resistances are as follows:-

1- Strong support between 5606-5628
2- Resistance between 5705-5728

Trend confirmation levels:-

1- Uptrend confirmation level is 200-Day SMA(5742) which is above Falling Trend line and sustaining above it will mean break out of that trend which stopped uptrend 3 times earlier.

2- Downtrend confirmation level is 200-Day EMA(5582) which is below strong support range of 5606-5628. Sustaining below it will mean trend reversal.

Indicators Analysis

Weekly indicators are below overbought zone,moving in upside direction and MACD intersected Average line upward therefore indicating big uptrend formation. Daily Indicators are in overbought zone and some are showing downward moves therefore showing some down moves.

Minor correction expected to cool down indicators and sentiments. As weekly indicators are telling for more upmoves possibility therefore Indicators are signalling  more upmoves after some correction.

Conclusions (After putting all studies together)

Uptrend is very much intact,corrections are its parts and was seen last Friday.Now any Bearish market will not be considered until complete distribution patterns will not be seen minimum on EOD charts,

Expexted that Nifty will first trade between 5610-5700 in whatsoever bearish/bullish sentiment in the beginning of next week and also expected that Nifty will firstly consolidate between this range in the coming sessions.

Expected that Nifty will finally cross resistance range(5705-5728) of last Friday and rally above 200-Day SMA(5742) will be seen.

2 Bullish Formations in EOD Charts

20 Months Rising Trend Line & Pennant Formations

Nifty-EOD Chart(08-Jul-2011):-
Just click on chart for its enlarged view
Technical Positions EOD charts

1- Started on 03-11-2009 from 4538
2- Nifty got support on it 7 times in last 20 months
3- Rising Trend Line broken down but moved above it sharply
4- Continuation Pattern Pennant Formations.
5- Falling Trend line of Pennant.

Conclusions

Nifty got support 7 times in last 20 Months at rising trend line. Although Nifty slipped below it after 'DTAA renegotiation' news in June 2011 but again moved above if after 4 days consolidation below it therefore mentioned rising trend line is very much intact and indicating up trend in Indian markets.

Corrective Wave-4 begun on 05-11-2010 from 6338 and Wave 5 started on 11-02-2011 from 5178. Last 8 months pre-correction and post-correction pattern is big Pennant which is continuation pattern. As larger trend is up therefore Continuation Pennant Pattern formation is also an indication of uptrend.

Nifty tested falling trend line of Pennant in 2 previous sessions and sustaining above it will be confirmation of next Bullish phase. Expected that Nifty will finally sustain above it and fresh up trend will be seen after possible correction in the beginning next week.