As busy therefore Stock Market Outlook of today(13-11-2020) is not being updated.

ॐ ह्रीं श्रीं लक्ष्मीभयो नमः॥

Follow up selling and today lowest will confirm Short term correction
Nifty-Intra Day Chart Analysis &
Market Outlook(12-11-2020)
Nifty-Intra Day Chart (11-Nov-2020):-

Technical Patterns formation in today intraday charts
1- Selling between 12709-12769
2- Sharp fall
3- Consolidation between 12572-12644
4- Slow up moves
5- Selling between 12725-12760
6- Whole day actual trading between 12572-12769
Conclusions from intra day chart analysis
Although firstly moved up after gap up opening but selling developed at higher levels therefore sharp fall was seen. As lower levels consolidation between 12572-12644 therefore up move were seen which were slow and follow up selling was seen at higher levels hence down moves are expected towards today lowest(12572) in the coming sessions. Once follow up selling and sustaining below today lowest will confirm Short term correction towards 12400.
Nifty above 18000 till Diwali-2021
Technical Analysis,Research &
Weekly Outlook(Nov 13 to Nov 20,2020)
As new life time high formation above 12430.50 on 09-10-2020 therefore Wave have to be recounted according to Elliott Wave theory which is being done in the following Diwali-2020 Outlook
Nifty-EOD Chart Analysis (Waves structure)
Nifty-EOD Chart (10-Nov-2020):-

Technical Patterns and Formations in EOD charts
1- Impulsive Wave-1 beginning from 6825.80 on 29-02-2016 after 1 financial year(2015-16) correction completion.
2- Impulsive Wave-1 completion at 8968.70 on 07-09-2016 and corrective Wave-2 beginning
3- Corrective Wave-2 completion at 7893.80 on 26-12-2016 and impulsive Wave-3 beginning
4- Impulsive Wave-3 completion at 11760.20 on 28-08-2018 and corrective Wave-4 beginning
5- Corrective Wave-4 completion at 10004.55 on 26-10-2018 and impulsive Wave-5 beginning
6-Impulsive Wave-5 completion after new life time high formation at 12430.50 on 20-01-2020 and Wave-A of "corrective ABC Waves" beginning
7- Corrective Wave-C completion at 7511.10 on 24-03-2020
8- Impulsive Wave-1 begun and now its Wave-5 is in continuation with recent top formation at 12643.90 on 10-11-2020
Conclusions from EOD chart analysis(Waves structure)
Impulsive Wave-1 begun from 6825.80 on 29-02-2016 after 1 financial year(2015-16) correction completion. Its impulsive Wave-5 completed after new life time high formation at 12430.50 on 20-01-2020 and Wave-A of "corrective ABC Waves" begun. Its corrective Wave-C completed at 7511.10 on 24-03-2020 and in this manner 29-02-2016 started Waves structure completed after it new Waves structue formed which is in continuation with recent top formation at 12643.90 on 10-11-2020
Nifty-EOD Chart Analysis (2020 Waves structure)
Nifty-EOD Chart (10-Nov-2020):-

Technical Patterns and Formations in EOD charts
1-Impulsive Wave-5 completion after new life time high formation at 12430.50 on 20-01-2020 and Wave-A of "corrective ABC Waves" beginning
2- Corrective Wave-C completion at 7511.10 on 24-03-2020
3- Impulsive Wave-1 begun and now its Wave-5 is in continuation with recent top formation at 12643.90 on 10-11-2020
Conclusions from EOD chart analysis
(2020 Waves structure)
Impulsive Wave-5 completion after new life time high formation at 12430.50 on 20-01-2020 and Wave-A of "corrective ABC Waves" started. As Corona panic all around therefore crashing like situation developed and its corrective Wave-C completed at 7511.10 on 24-03-2020.
Waves structure which developed through Impulsive Wave-1 from 6825.80 on 29-02-2016 completed at 7511.10 on 24-03-2020 after "ABC" correction completion. After it new 2020 Waves structure formed and now it is in continuation with recent top formation at 12643.90 on 10-11-2020
Nifty-EOD Chart Analysis (2020 Correction Waves)
Nifty-EOD Chart (10-Nov-2020):-

Technical Patterns and Formations in EOD charts
1-Impulsive Wave-5 completion after new life time high formation at 12430.50 on 20-01-2020 and Wave-A of "corrective ABC Waves" beginning
2-Wave-A (11614.50 on 03-02-2020)
3-Wave-B (12246.70 on 14-02-2020)
4-Corrective Wave-C completion at 7511.10 on 24-03-2020.
5-Impulsive Wave-1 of new Waves structure begun at 7511.10 on 24-03-2020 which is continuation
Conclusions from EOD chart analysis
(2020 Correction Waves)
"ABC" correction started after new life time high formation at 12430.50 on 20-01-2020. Its Wave-A completed at 11614.50 on 03-02-2020 and Wave-B finished at 12246.70 on 14-02-2020 but Wave-C was in crashing mode because Covid-19 panic developed Globally and sharp huge fall was seen in all the Global markets which was followed by Indian markets also.
Corrective Wave-C completed at 7511.10 on 24-03-2020 and Impulsive Wave-1 of new Waves structure started.
Nifty-EOD Chart Analysis
(2020 Rally Waves structure)
Nifty-EOD Chart (10-Nov-2020):-

Technical Patterns and Formations in EOD charts
1- Corrective Wave-C completion and Impulsive Wave-1 beginning from 7511.10 on 24-03-2020
2- Wave-1 (9889.05 on 30-04-2020)
3- Wave-2 (8806.75 on 18-05-2020)
4- Wave-3 (11794.30 on 31-08-2020)
5- Wave-4 (10790.20 on 24-09-2020)
6- Impulsive Wave-5 continuation with recent top formation at 12643.90 on 10-11-2020
Conclusions from EOD chart analysis
(2020 Rally Waves structure)
Corrective Wave-C completed and Impulsive Wave-1 of new Waves structure started from 7511.10 on 24-03-2020,its impulsive Wave-5 is in continuation now with recent top formation at 12643.90 on 10-11-2020
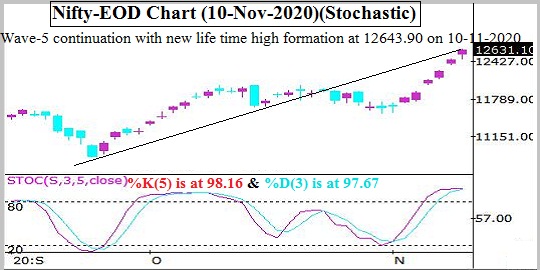
Nifty-EOD Chart Analysis (Stochastic)
Nifty-EOD Chart (10-Nov-2020):-
Technical Patterns and Formations in EOD charts
1- Wave-5 continuation with new life time high formation at 12643.90 on 10-11-2020
2- Stochastic- %K(5) is at 98.16 & %D(3) is at 97.67
Conclusions from EOD chart analysis (Stochastic)
Rally continuation with new life time high formation at 12643.90 but Short Term indicator Stochastic has moved into Over bought zone therefore Short Term correction has become due. As intraday charts and EOD charts have not shown any selling patterns till now therefore some more up moves can not be ruled out but expected that Short Term correction will be seen after fresh selling patterns in the next 2/3 sessions.
Conclusions (After Putting All Studies Together)
All Trends are up just before Diwali-2020 and continuous new life time high formation for the last 2 sessions in that situation when GDP IS -25.2 and whole country is in Corona pandemic grip as well as its cases have started to increase.
Main reason of strong recovery of Nifty from 7511.10 to new life time high in 2020 are as follows:-
1- Jump of profits in IT sector due to new work culture of "Work at Home" and resultant NiftyIT Index rallied 105% in only 7 months from 10992 on 19-03-2020 to 22619 on 13-10-2020.
2- As China conspired Corona therefore high Global anger against it and resultant many countries have decided to shift their companies from China to other countries and resultant many multinational companies may come and start business in India
3- "Make in India" concept will develop industrial production in India,resultant Exports and GDP will increase as well as India Rupee will also strengthen.
Although new life time high formations but Short to Long Term indicators have turned Over bought therefore correction is very much due which will be seen. As selling patterns have not been developed yet on EOD charts and intraday charts therefore immediate deeper correction will not be seen,let it happen then Short to Long Term correction will be seen but finally rally will remain continued towards and above 18000 in the coming year till Diwali-2021.
More consolidation & today highest will confirm fresh rally
Nifty-Intra Day Chart Analysis &
Market Outlook(11-11-2020)
Nifty-Intra Day Chart (10-Nov-2020):-

Technical Patterns formation in today intraday charts
1- Consolidation between 12476-12500
2- Sharp up
3- Up moves in Bearish Rising Channels
4- Intraday corrections
5- Whole day actual trading between 12476-12643
Conclusions from intra day chart analysis
As firstly consolidation after gap up opening therefore sharp up moves were seen. Although after that whole day up moves were in Bearish Rising Channel and consolidation was also seen through continuous correction but last hour Up moves were in Bearish Rising Channels therefore more consolidation is firstly required tomorrow for sustaining above today highest(12643.90) which should be watched tomorrow for fresh rally above this level.
On going rally continuation
Nifty-Intra Day Chart Analysis &
Market Outlook(10-11-2020)
Nifty-Intra Day Chart (09-Nov-2020):-

Technical Patterns formation in today intraday charts
1- Down moves in Bullish Falling Channel
2- Up moves with downward corrections
3- Whole day actual trading between 12368-12474
Conclusions from intra day chart analysis
Firstly huge gap up opening with new life time high formation and after that whole day consolidation through Down moves in Bullish Falling Channel and Up moves with downward corrections therefore on going rally will remain continued in the coming sessions.
As following Corona vaccine most positive news therefore Dow Jones and SGX Nifty are trading more than 4.5% up and more than 250 points up respectively hence rally continuation with huge gap up opening will be seen tomorrow.
Subscribe to:
Posts (Atom)