Finally fresh rally amid only Very
Short term correction possibility
Technical Analysis,Research & Weekly
Outlook(Sep 11 to Sep 15,2023)
Nifty-EOD Chart Analysis
(Waves structure)
Nifty-EOD Chart (08-Sep-2023):-

Technical Patterns and Formations in EOD charts
1- Corrective Wave-C of "ABC correction" completion at 15183.4 on 17-06-2022 and Impulsive Wave-1 of new Waves structure beginning.
2- Impulsive Wave-[(i)] of Wave-1 completion at 18096.2 on 15-09-2022.
3- Corrective Wave-[(ii)] of Wave-1 completion at 16747.7 on 30-09-2022.
4- Impulsive Wave-(i) of Wave-[(iii)] of Wave-1 completion at 18887.6 on 01-12-2022 and Corrective Wave-A of "ABC" correction begining.
5- Corrective Wave-A of Wave-[(ii)] of Wave-[(iii)] of Wave-1 completion at 17774.3 on 26-12-2022.
6- Corrective Wave-B of Wave-[(ii)] of Wave-[(iii)] of Wave-1 completion at 18265.3 on 30-12-2022.
7- Corrective Wave-C of Wave-[(ii)] of Wave-[(iii)] of Wave-1 completion at 16828.3 on 20-03-2023.
8- Impulsive Wave-[(iii)] of Wave-[(iii)] of Wave-1 continuation with recent top formations at 19991.8 on 20-07-2023.
9- Short Term correction completion strong indications at 19223.7 on 31-08-2023 after previous 15 Sessions trading range(19224-19584) forcefully broken out in previous week.
10- Pull Back Rally continuation with recent top formations at 19867.15 on 08-09-2023.
Conclusions from EOD chart analysis
(Waves structure)
Impulsive Wave-1 of new Waves structure started from 15183.4 on 17-06-2022 after Corrective Wave-C of "ABC correction" of previous Waves structure completion at this level. Impulsive Wave-[(i)] of Wave-1 completed at 18096.2 on 15-09-2022 and Corrective Wave-[(ii)] of Wave-1 begun which completed at 16747.7 on 30-09-2022 and from this levels impulsive Wave-[(iii)] of Wave-1 started.
Impulsive Wave-(i) of Wave-[(iii)] of Wave-1 completed at 18887.6 on 01-12-2022 and its "ABC" correction begun, Corrective Wave-C of "ABC" correction completed at 16828.3 on 20-03-2023. From this level Impulsive Wave-[(iii)] of Wave-[(iii)] of Wave-1 started which is in continuation with recent and life time top formations at 19991.8 on 20-07-2023. Although no confirmations of its completion yet on EOD charts but Short Term correction started from this level which is in continuation with recent bottom formations at 19223.7 on 31-08-2023. Pull Back Rally begun from this level which is in continuation with recent top formations at 19867.15 on 08-09-2023 and no confirmation of its conpletion yet.
Nifty-EOD Chart Analysis
(Stochastic & MACD)
Nifty-EOD Chart (08-Sep-2023):-

Technical Patterns and Formations in EOD charts
1- Stochastic- Its both lines are kissing in Over bought zone.
2- Stochastic:- %K(5)- 93.64 & %D(3)- 94.97.
3- In MACD- MACD line has intersected Average line upward and its MACD line is rising in positive while its Average line is rising in negative zone.
4- MACD(26,12)- 49.80 & EXP(9)- -63.74 & Divergence- 113.54
Conclusions from EOD chart analysis
(Stochastic & MACD)
Positions of Daily indicators are as follows:-
1- As in Stochastic its both lines are kissing in Over bought zone therefore first indication of Short term correction has emerged. Let %K(5) line to intersect %D(3) line downward then Short term correction beginning will be seen.
2- As in MACD indicator its MACD line has intersected Average line upward and its MACD line is rising in positive zone while its Average line is rising in negative zone therefore indications of Short term upward trend formations have emerged. Let its Average line also to move into positive zone then decisive up moves will be seen after upward trend formation confirmations.
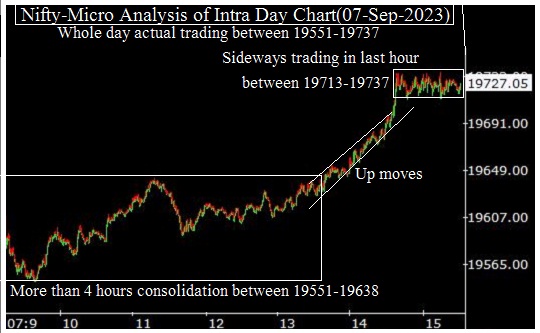
Nifty-Intra Day Chart Analysis
(08-Sep-2023)
Nifty-Intra Day Chart (08-Sep-2023):-

Technical Patterns formation in today intraday charts
1- Selling between 19767-19794
2- Support between 19728-19763
3- Sharp up moves
4- Mixed Patterns formation in last 4 hours between 19796-19867
5- Whole day actual trading between 19728-19867
Conclusions from intra day chart analysis
As selling developed after positive opening therefore down moves started and once Nifry lost all intraday gains also but lower levels supports developed and sharp up moves were seen after after that. Although Nifty closed with 0.47% gains last Friday but Mixed Patterns formation were seen in last 4 hours between 19796-19867 which means that both consolidation and selling patterns developed within this range therefore:-
1- Nifty will firstly trade and prepare for next Very Short term moves beginning within and near about this range.
2- Finally sustaining beyond this range will confirm next Very Short term moves beginning hence it should be firstly watched in the beignning of next week.
Conclusions
(After putting all studies together)
1- Long Term trend is up.
2- Intermediate Term trend is up.
3- Short Term trend is up.
Short Term correction begun from 19991.8 on 20-07-2023 and no confirmations of its completion yet on EOD charts at its recent bottom at 19223.7 but strong indications of its completion have emergeed at this level because the Pull Back rally which started form this levels has:-
1- Forcefully broken out Previous 15 Sessions trading range(19224-19584) in last week.
2- Nifty has remained only 124.65 points shorter than life time top at 19991.8.
As Short term indicator Stochastic is suggesting that Short term correction is on cards and MACD has also not 100% confirmned Upward Trend formations as well as some intraday selling patterns were also seen last Friday therefore Very Short Term correction may be seen in next week but finally rally continuation is expected towards following next resistances towards and above life time highest:-
1- 19831-19842
2- 19869-19991
Immediate Supports below last Friday closing are as follows which should be watched during expected Very Short Term correction are:-
1- 19728-19763
2- 19551-19638
Finally fresh rally towards and above life time highest(19991.8) but firstly watch above supports and resistances amid only Very Short term correction possibility.