ॐ ह्रीं श्रीं लक्ष्मीभयो नमः॥


Trading "calls" from our "Software" with more than "90% accuracy"

More than "12 years" old "only site of whole world" 
with more than "9700 accurate Outlooks" of 
"Indian Stock Markets" 

Weekly Indicators and Averages Analysis


Weekly Indicators and Averages Analysis Chart:-
Just click on chart for its enlarged view
Conclusions from Weekly Indicators and Averages Analysis

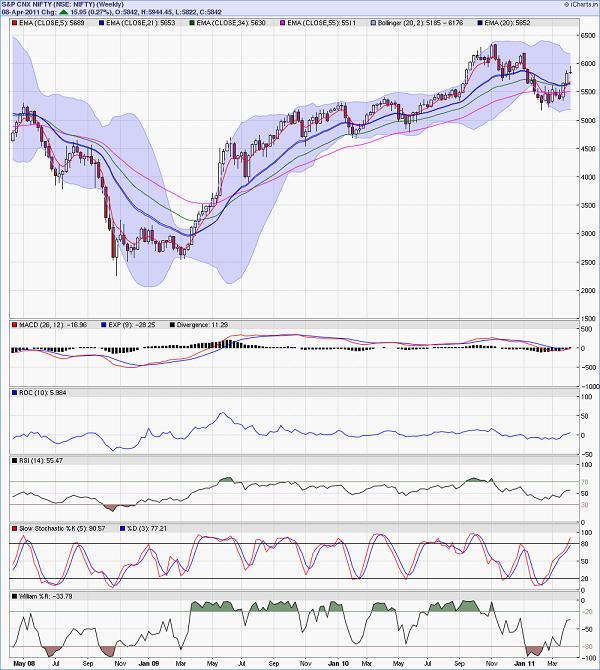
1-Averages- All(5,21,34,55) the shorter term weekly averages are above longer term weekly averages and Nifty is above all.It is Bullish market confirmation.

2-Bollinger Band- Nifty is in the middle of band little above middle line and indicating possibility of more up moves.

3- MACD- Most important development this week that MACD line intersected Average line up side and given confirmation to rally. Weekly MACD cross over gives confirmation to long trend therefore strong confirmation to up trend.

4-ROC- moved above equalibrium line and given up moves confirmations.

5-RSI- moved above equalibrium line and given up moves confirmations.

6-Slow Stochastic- Both lines in overbought zone but tend to remin in overbought area for a longer period and until other indicators does not gives downward confirmation till then will remain in overbought zone.

7-William %R- is below overbought zone,moving upward and showing more upmoves possibility.

Conclusion


Weekly indicators are showing begining and continuation of upmoves while daily indicators are overbought and showing begining of correction. Firstly Daily indicators will cool down and after that rally will resume after last week begun correction completion.

Daily Indicators and Averages Analysis


Just click on chart for its enlarged view

Long Term and Intermediate term trends are up and very short term trend is down.

Conclusions from Daily Indicators and Averages Analysis

1-Averages- All(8,21,55,200) the shorter term averages are above longer term averages and Nifty is above all.It is Bullish market confirmation.

2-Bollinger Band- Upper Band moved up with Nifty rally and gap between both bands expanded. Squeeezing of both bands is technical requirement. It is the nature of  Bollinger band that price tends to return to the middle of the bands and Nifty retracement toward the middle of Band is possible which is near 5700.

3-MACD- MACD Line is above Average Line and gap increased in both lines therefore convergance in both lines is technical requirement. Nifty down move has begun in previous week and more down move is also possible in the process of convergance.

4-ROC- is retracing and equalibrium line testing possibility can not be rules out in correction process.

5-RSI- is retracing from overbought zone and equalibrium line testing possibility can not be rules out in correction process.

6-Slow Stochastic- very short term fast moving indicator and both lines have started to move down from overbought zone and indicating more down moves

7-William %R- very short term fast moving indicator and in overbought zone. It has tendency to remin overbought. As other indicators are also indicating correction therefore  its dipping from overbought can not be ruled out.

Conclusion

Correction begun in previous week and insicators are suggesting its continuation in the coming week

Weekly MACD upward intersection & Weekly Gravestone Doji Candle


Just click on chart for its enlarged view

Weekly MACD upward intersected Average Line in previous week after 19-11-2011 and given positive moves strong indication but on the other hand 'Gravestone Doji Candle'(Bearish) formation in previous week

Weekly MACD:- 3rd wave which begun on 13-07-2009 from 3919, terminated at 6338 on 05-11-2010 and 4th corrective wave begun which terminated at 5177 on 11-02-2011. Weekly MACD upward intersection Average Line in previous week is 4th corrective wave termination and 5th impulsive wave begining confirmation.

Gravestone Doji:- 5th impulsive wave begun on 11-02-2011 from 5177 and faced resistance at 5944 in previous week. Gravestone Doji weekly Candle in previous week is Short term correction begining confirmation of 1st leg of 5th wave.

Conclusion

Nifty will first correct 1st leg of 5th wave(5177-5944) according to Fibonacci Retracement levels in the coming week and then rally will begun to test levels above 6120.

Fibonacci Retracement Levels

Rally begun on 11-02-2011 from 5177
Correction of this rally begun on 06-04-2011 from 5944

Fibonacci Retracement Levels of on going correction are as follows:-


13.0%- 5844
23.6%- 5762
27.0%- 5736
38.2%- 5651
50.0%- 5560
61.8%- 5469
70.7%- 5401
76.4%- 5358
78.6%- 5341
88.6%- 5264

Micro-Analysis of Nifty Intra Day Charts(08-04-2011)


Just click on chart for its enlarged view

1- Selling between 5855-5875
2- Down Move in Falling Channel
3- Slow Down Move without Force
4- Intra day last hour consolidation between 5823-5842

Last 3 days range broken down after intraday selling but breaking down is without force in falling channel and last hour intra day consolidation seen between 5823-5842.

Conclusion
Correction is confirm on but breaking down move was without force therefore it is an indication of early correction completion but market require confirmations. Firstly complete consolidation and then crossing of immediate resistance will be first corretion completion confirmation.

FII Trading Data in Derivatives Segment on 08-Apr-2011


Nifty Spot-Levels & Trading Strategy for 11-04-2011

Nifty Spot-Levels

R3 6008
R2 5967
R1 5904
Avg 5863
S1 5800
S2 5759
S3 5696

Nifty Spot-Trading Strategy

H6 5946     Trgt 2
H5 5922     Trgt 1
H4 5899     Long breakout
H3 5870     Go Short
H2 5861
H1 5851
L1 5832
L2 5822
L3 5813     Long
L4 5784     Short Breakout
L5 5761     Trgt 1
L6 5737     Trgt 2

Nifty(Apr Fut)-Levels & Trading Strategy for 11-04-2011

Nifty(Apr Fut)-Levels

R3 6006
R2 5966
R1 5910
Avg 5870
S1 5814
S2 5774
S3 5718

Nifty(Apr Fut)-Trading Strategy

H6 5950     Trgt 2
H5 5928     Trgt 1
H4 5906     Long breakout
H3 5880     Go Short
H2 5871
H1 5862
L1 5845
L2 5836
L3 5827     Long
L4 5801     Short Breakout
L5 5779     Trgt 1
L6 5757     Trgt 2

Bank Nifty(Apr Fut)-Levels & Trading Strategy for 11-04-2011

Bank Nifty(Apr Fut)-Levels

R3 12069
R2 11979
R1 11845
Avg 11755
S1 11621
S2 11531
S3 11397

Bank Nifty(Apr Fut)-Trading Strategy

H6 11935     Trgt 2
H5 11885     Trgt 1
H4 11834     Long breakout
H3 11772     Go Short
H2 11752
H1 11731
L1 11690
L2 11669
L3 11649     Long
L4 11587    Short Breakout
L5 11536     Trgt 1
L6 11486     Trgt 2

Nifty Spot-Weekly Levels & Trading Strategy(11 Apr to 15-04-2011)

Nifty Spot-Weekly Levels

R3 6038
R2 5991
R1 5916
Avg 5869
S1 5794
S2 5747
S3 5672

Nifty Spot-Weekly Trading Strategy

H6 5964     Trgt 2
H5 5936     Trgt 1
H4 5909     Long breakout
H3 5875     Go Short
H2 5864
H1 5853
L1 5830
L2 5819
L3 5808     Long
L4 5774     Short Breakout
L5 5747     Trgt 1
L6 5719     Trgt 2

FII & DII trading activity in Capital Market Segment on 08-Apr-2011

FII trading activity on NSE and BSE in Capital Aprket Segment(In Rs. Crores)
CategoryDateBuy ValueSell ValueNet Value
FII08-Apr-20112688.692303.84384.85


DII trading activity on NSE and BSE in Capital Aprket Segment(In Rs. Crores)
CategoryDateBuy ValueSell ValueNet Value
DII08-Apr-2011982.971111.37-128.4

Pre-closing Outlook(08-04-2011)

Nifty slipped below 5857 after today fresh selling between 5857-5870 but down move is without force and last one hour move is giving intra day support signals between 5825-5840. Correction is on and its completion signals not generated yet.

Mid-session Outlook(08-04-2011)

Nifty traded 3 days between 5855-5945 and technical positions within this range has already been explained in 3 previous outlooks. Certainly Indian markets under performed Asian markets,slipped sharply in first hour,moved below 5855 but not sustained below 5855 also and trading between 5943-5870. It means market has not given breaking down confirmation yet despite slipping below lower levels.

5857-5870 was base formation range of 05-04-2011 and Nifty is trading betwen this range after 1st hour slipping. Breaking out conclusions of this range will be as folluws:-

1- Sustaining above 5870 will mean revival of up move hopes and testing possibility of levels up to 5945.
2- Sustaining below 5857 will mean deeper correction.
 
Although 5855 broken down today but confirmation required and final view should be formed according to break out of 5843-5870

Post-open Outlook(08-04-2011)

Although all the Asian markets turned positive after flat opening and sentiment improved but Indian markets slips from day's higher levels and trading in Red because correction is on.

Confirmation levels have already been expressed in 2 previous outlooks therefore final conclusions will be drawn according to that. Nifty is trading at 5859 and today low is at 5855.40. Sustaining below 5855 will mean certain deeper correction.

Pre-Open Market Outlook(08-04-2011)

Following line was told in Post-closing Report(25-03-2011) & Monday Outlook:-

"21st March 2011 started rally minimum target is 5911"

More than 10 times only 5900 was told after above line and rally halted exactly at 5900 and Nifty is hovering it around for the last 3 days.

Sentiment were heated,Indicators were overbought and 596 points rally seen in 12 sessions therefore correction was natural and being seen for the last 3 days. Market may correct in narrow range or little deeper down moves and it will be decided through last 3 days broader range(5855-5945). Next moves after break out of last 3 days range(5855-5945) will be as follows:-

1- Crossing and sustaining above 5945 will mean 6120 fast
2- Slipping and sustaining below 5855 will mean deeper correction.

Market is not prepared for any side moves and will take its own time in this process. Global cues are quiet today morning and Nifty will trade first within 5870-5915. Technical positions within both ranges have alreay been discussed yesterday in "Post-closing Report(07-04-2011) & Tomorrow Outlook" and not being repeated today.

As I told in last 3 days same is repeating today that let market prepare then final conclusions will be drawn from intraday patterns. Last 3 days closing is also almost flat without much gains or loss. Real moves will be seen after break out of mentioned ranges therefore will be better to wait for its happening and next real moves confirmations.

Post-closing Report(07-04-2011) & Tomorrow Outlook

Nifty Candle- Doji(Confusion)
Nifty Intra day trading patterns- Mixed Formations
Nifty trading range- 5867-5906
Consolidation between- 5867-5680
Distribution between- 5888-5905

Whole day narrow range market with intraday supports at lower levels and resistance at higher levels. Mid cap Cap and BSE Small Cap Indices with good gains and positive trading patterns

Put Call Ratio : 1.05

Advances & Declines:

NSE ADVANCES : 1,921
NSE DECLINES : 1,037
BSE ADVANCES : 1,460
BSE DECLINES :   687

Nifty Open Interest Changed Today:-

Nifty- 5800 CE(28APR2011)- +25350(+0.59%)
Nifty- 5800 PE(28APR2011)- +553200(+10.73%)

Nifty- 5900 CE(28APR2011)- +902150(+17.26%)
Nifty- 5900 PE(28APR2011)- +661450(+20.37%)

Nifty- 6000 CE(28APR2011)- +222400(+3.46%)
Nifty- 6000 PE(28APR2011)- -34900(-1.88%)

Closing :-

Nifty- closed at 5,885.70(-6.05 Points & -0.10%)
Sensex- closed at 19,591.18(-21.02 Points & -0.11% )
CNX MIDCAP - closed at 8,419.05(+77.05 Points & +0.92%)
BSE SMALL CAP- closed at 8,897.19(+110.25 Points & +1.25%)

Nifty Intra Day Chart of Today:-
Just click on chart for its enlarged view
Tomorrow(08-04-2011) Outlook


Mixed formations and Indian markets are not prepared for any side decisive moves. Firstly trading between 5870-5910 and sustaining beyond this range will give strong indication of break out side of broader range(5855-5945).
          
Trending market is expected in next week after break out of mentioned last 3 days brodaer range and Nifty will trade within this range tomorrow. .

Trend Deciding Intra Day Ranges

Following Ranges developed in last 3 days intra day charts:-

1- Broader Range and its break out will give next big moves confirmations - 5857-5945
2- Narrow Range and its break out will give first strong indication of next moves- 5870-5915
Just click on chart for its enlarged view
Patterns within above ranges are:-

1- 05-04-2011- Support between- 5857-5870
2- 06-04-2011- Selling between- 5880-5910
3- 07-04-2011- Support between- 5867-5680
                         Selling between- 5888-5905

Next strong moves will be decided from the break out and sustaining beyond above ranges. Indian markets will prepare within mentioned ranges in the same manner as prepared today and break out will generate sharp moves.

FII & DII trading activity in Capital Market Segment on 07-Apr-2011

FII trading activity on NSE and BSE in Capital Aprket Segment(In Rs. Crores)
CategoryDateBuy ValueSell ValueNet Value
FII07-Apr-20112675.952455.36220.59


DII trading activity on NSE and BSE in Capital Aprket Segment(In Rs. Crores)
CategoryDateBuy ValueSell ValueNet Value
DII07-Apr-2011881.681093.84-212.16

FII Trading Data in Derivatives Segment on 07-Apr-2011


Nifty Spot-Levels & Trading Strategy for 08-04-2011

Nifty Spot-Levels

R3 5912
R2 5909
R1 5897
Avg 5894
S1 5882
S2 5879
S3 5867

Nifty Spot-Trading Strategy

H6 5899     Trgt 2
H5 5896     Trgt 1
H4 5893     Long breakout
H3 5889     Go Short
H2 5887
H1 5886
L1 5883
L2 5882
L3 5880     Long
L4 5876    Short Breakout
L5 5873    Trgt 1
L6 5870    Trgt 2

Nifty(Apr Fut)-Levels & Trading Strategy for 08-04-2011

Nifty(Apr Fut)-Levels

R3 5980
R2 5956
R1 5929
Avg 5905
S1 5878
S2 5854
S3 5827

Nifty(Apr Fut)-Trading Strategy

H6 5953     Trgt 2
H5 5941     Trgt 1
H4 5930     Long breakout
H3 5916     Go Short
H2 5911
H1 5906
L1 5897
L2 5892
L3 5887     Long
L4 5873     Short Breakout
L5 5862     Trgt 1
L6 5850     Trgt 2

Bank Nifty(Apr Fut)-Levels & Trading Strategy for 08-04-2011

Bank Nifty(Apr Fut)-Levels

R3 12067
R2 11971
R1 11886
Avg 11790
S1 11705
S2 11609
S3 11524

Bank Nifty(Apr Fut)-Trading Strategy

H6 11983     Trgt 2
H5 11942     Trgt 1
H4 11900     Long breakout
H3 11850     Go Short
H2 11834
H1 11817
L1 11784
L2 11767
L3 11751     Long
L4 11701    Short Breakout
L5 11659     Trgt 1
L6 11618     Trgt 2

Pre-closing Outlook(07-04-2011)


Followimg lines were told in Pre-open Outlook today:-

"Firstly trading will be betweeen 5880-5915"

Nifty traded most of the time between mentioned range. Intra day consolidation and support developed between 5867-5680 today and when up moves started then rally confirmation levels(5910) was posted for traders safety in Mid-session Outlook and Nifty reversed without giving rally confirmations.

Market is range bound near 5900 and preparing for decisive big moves within 5855-5945 and selling at higher levels and buying at lower levels seen within this range. Crossing and sustaining above 5945 is expected but final conclusion well be drawn after coming sessions intra day charts analysis.

Mid-session Outlook(07-04-2011)

Intra day consolidation and support developed between 5867-5680 today. Up moves started and first confirmation rally is above 5910

Post-open Outlook(07-04-2011)

As selling signals yesterday therefore slipping was expected today. Selling signals between 5880-5910 was told during trading hours yesterday and base formations between 5857-5870 was told on 05-04-2011. Nifty moved below 5880 and got intraday first support near 5870 today. 5857-5870 is first support whole rally is safe above it. Follow up moves today will decide next moves today. I clearly mean to day that:-

1- Follow up selling today will mean breaking down below 5855 and deeper correction.
2- Consolidation today will mean yesterday started very short term correction completion.

Nifty is trading between last 2 days ranges and break out of these ranges will give next moves first strong indication;-

05-04-2011- 5857-5870(Base formation and support)
06-04-2011- 5880-5910(selling signals)

Pre-Open Market Outlook(07-04-2011)


Technical Positions,today Outlook and next possibilities have already been posted in following topic with 1 Chart yesterday therefore not being repeated today:-

"Post-closing Report(06-04-2011) & Tomorrow Outlook"

It was clearly told during trading hours yesterday that intraday charts are showing selling signals between 5880-5910 and supressed sentiments today due to weak Asian markets and hike in Crude rates in internetional markets.

Base formation and support between 5857-5870 on 05-04-2011 and deeper correction confirmation point will be below 5855. Firstly trading will be betweeen 5880-5915 and next moves confirmation range is sustaining beyond 5855-5945.

As selling signals yesterday therefore dipping is possible after subdued weaker sentiment today morning and today follow up selling will mean deeper correction. Final views will be formed after watching today intra day charts.

Post-closing Report(06-04-2011) & Tomorrow Outlook

Intra day correction,Nifty traded most of the time between 5885-5915 with selling signals and many pivotal stocks also showed intraday selling patterns today. Whole market or most of the market is not indicating selling but on the other hand suggesting buying. Final conclusion from today intra day patternd is that patterns are mixed and more preparation is required in the coming sessions for any side decisive moves.

Put Call Ratio : 1.03

Advances & Declines:

NSE ADVANCES : 1780
NSE DECLINES : 1167
BSE ADVANCES :  864
BSE DECLINES :  549

Nifty Open Interest Changed Today:-

Nifty- 5800 CE(28APR2011)- +178750(+4.34%)
Nifty- 5800 PE(28APR2011)- +443800(+8.99%)

Nifty- 5900 CE(28APR2011)- +691000(+14.96%)
Nifty- 5900 PE(28APR2011)- +507100(+18.51%)

Nifty- 6000 CE(28APR2011)- +561650(+9.24%)
Nifty- 6000 PE(28APR2011)- +68600(+3.84%)

Closing :-

Nifty- closed at 5891.75(-18.30 Points & -0.31%)
Sensex- closed at 19612.20(-74.62 Points & -0.38% )
CNX MIDCAP - closed at 8342.00(+36.00 Points & +0.43%)
BSE SMALL CAP- closed at 8786.94(+68.22 Points & +0.78%)

Nifty Intra Day Chart of Today:-
Just click on chart for its enlarged view
Tomorrow(07-04-2011) Outlook

Mixed formations today and it means that Indian markets are not prepared for any side decisive moves and Nity will first prepare for next moves within 5885-5915.
  
Following range break out and sustaining beyond will give following conclusions:-

1 1st range is 5885-5915 and its break out will be strong confirmation of testing of next higher(5945)/lower(5855) levels.

2- 2nd range is 5855-5945 and its break out direction will be first derived from break out of above mentioned 1st range. Break out of this range will decide following next moves:-

1- Sustaining above 5945 will mean 6120 fast.
2- Sustaining below 5855 will mean deeper correction

As sentiment was heated,Indicators were overbought therefore very short term correction was expected and seen. Firstly trading between 5885-5915,finally consolidation between 5855-5945 and after that rally above 5915 expected in the coming sessions. As mixed patterns therefore for precaution break out of 5885-5915 will be watched also.

Next Big Moves Confirmations ?


Just click on chart for its enlarged view

Nifty traded most of the time between 5885-5915 today and selling signals observed between this range. At lower levels immediate support and base formation is between 5857-5870 yesterday.

Following range break out and sustaining beyond will give following conclusions:-

1 1st range is 5885-5915 and its break out will be strong confirmation of testing of next higher(5945)/lower(5855) levels.

2- 2nd range is 5855-5945 and its break out direction will be first derived from break out of above mentioned 1st range. Break out of this range will decide following next moves:-

1- Sustaining above 5945 will mean 6120 fast.
2- Sustaining below 5855 will mean deeper correction

Although selling signals between 5885-5915 today but I am expecting consolidation and finally crossing of 5945 in the coming sessions. Above levels have been given for safety also.

FII & DII trading activity in Capital Market Segment on 06-Apr-2011

FII trading activity on NSE and BSE in Capital Aprket Segment(In Rs. Crores)
CategoryDateBuy ValueSell ValueNet Value
FII06-Apr-20112856.442327.97528.47


DII trading activity on NSE and BSE in Capital Aprket Segment(In Rs. Crores)
CategoryDateBuy ValueSell ValueNet Value
DII06-Apr-20111118.811649.86-531.05

Nifty Spot-Levels & Trading Strategy for 07-04-2011

Nifty Spot-Levels

R3 6010
R2 5977
R1 5934
Avg 5901
S1 5858
S2 5825
S3 5782

Nifty Spot-Trading Strategy

H6 5967     Trgt 2
H5 5950     Trgt 1
H4 5932     Long breakout
H3 5911     Go Short
H2 5904
H1 5897
L1 5884
L2 5877
L3 5870     Long
L4 5849     Short Breakout
L5 5831     Trgt 1
L6 5814     Trgt 2

Nifty(Apr Fut)-Levels & Trading Strategy for 07-04-2011

Nifty(Apr Fut)-Levels

R3 6051
R2 6011
R1 5960
Avg 5920
S1 5869
S2 5829
S3 5778

Nifty(Apr Fut)-Trading Strategy

H6 6001     Trgt 2
H5 5980     Trgt 1
H4 5960     Long breakout
H3 5935     Go Short
H2 5926
H1 5918
L1 5901
L2 5893
L3 5884     Long
L4 5859     Short Breakout
L5 5839     Trgt 1
L6 5818     Trgt 2

Bank Nifty(Apr Fut)-Levels & Trading Strategy for 07-04-2011

Bank Nifty(Apr Fut)-Levels

R3 12041
R2 11969
R1 11877
Avg 11805
S1 11713
S2 11641
S3 11549

Bank Nifty(Apr Fut)-Trading Strategy

H6 11949     Trgt 2
H5 11912     Trgt 1
H4 11875     Long breakout
H3 11830     Go Short
H2 11815
H1 11800
L1 11769
L2 11754
L3 11739     Long
L4 11694     Short Breakout
L5 11657     Trgt 1
L6 11620     Trgt 2

Pre-closing Outlook(06-04-2011)


Nifty traded most of the time between 5880-5910 today and selling signals seen between this range today. At lower levels immediate support range is 5857-5870. More or less patterns are mixed and market requires more time for break out of 5855-5940 for decisive moves.

Expected that Nifty will again trade and prepare for next moves within 5855-5940 and final conclusions should be drawn after its break out.

Mid-session Outlook-3(06-04-2011)


Intraday charts are showing selling signals between 5880-5910 today. Nifty is trading at 5893 and first confirmation will be mentioned range break out.

Mid-session Outlook-2(06-04-2011)

some stocks selling, mixed Trading patterns and today consolidation demand within 5855-5940 was told in 5 previous outlooks.For this following lines were told:-

1- Most Indices patterns and most pivotal stocks are showing consolidations but some stocks intraday patterns showed selling formations also today.
2- As selling in some pivotal stocks today therefore today range(5855-5920) will be watched first
3- follow up buying tomorrow will mean fresh strong rally in the coming sessions
4- Nifty next move confirmation range is 5855-5940 and Nifty will prepare for next moves within range first.
5-Trading patterns were mixed yesterday and markets require clear formations for decisive break out.

Base formation within 5857-5870 yesterday and next move confirmation range is 5855-5940. If Nifty moves below 5855 then expect deeper correction and sharp surges will be seen above 5940. Market is preparing within 5855-5940 and expect big moves beyond this range.

Mid-session Outlook(06-04-2011)

Nifty crossed 5940,could not sustain above,faced resistance and slipped. As doubt therefore sustaining above 5940 condition was told in Post-open Outlook and also cautioned at 5932 in Post-open Outlook-2.

Following lines were told in Pre-Open Market Outlook today and should be kept in mind for deciding next moves:-

1- Nifty next move confirmation range is 5855-5940 and Nifty will prepare for next moves within range first.

2-Trading patterns were mixed yesterday and markets require clear formations for decisive break out.

Post-open Outlook-2(06-04-2011)


It was clearly told today:-

"sustaining above 5940 will mean strong rally toward 6120"

Nifty slipped below 5940 and trading at 5932. Let markets prepare and sustain above 5940 then draw final conclusion.

Post-open Outlook(06-04-2011)

Market showed strength after opening today and crossed 5940, sustaining above 5940 will mean strong rally toward 6120.

Pre-Open Market Outlook(06-04-2011)

Technical Positions,today Outlook and next possibilities have already been posted in following topic with 2 Charts in my Blog yesterday therefore not being repeated today:-

"Post-closing Report(05-04-2011) & Tomorrow Outlook"

As Nifty achieved 5911(told on 25-03-2011) target and Nifty was facing resistance at falling trend line therefore 4 intraday outlooks were posted in my blog yesterday and clearly told for base formations(5857-5870) and after that last hours up move begun yesterday. Mentioned base formations range is today first support.

Nifty next move confirmation range is 5855-5940 and Nifty will prepare for next moves within range first. Trading patterns were mixed yesterday and markets require clear formations for decisive break out for following moves:-

1- Crossing 5940 will mean fast rally toward 6120
2- Dipping below 5855 will mean deeper correction.

Let market prepare then next immediate next moves will be decided from intraday charts analysis of coming sessions.

Post-closing Report(05-04-2011) & Tomorrow Outlook

Market is as follows after today closing;-

Intraday correction and recovery from lower levels seen today. Most Indices patterns and  most pivotal stocks are showing consolidations but some stocks intraday patterns showed selling formations also today.

Nifty trading range- 5857-5920
Nifty Candle- Bullish Hammer
Nifty Support and Base formation between- 5857-5870 
Nifty Intra day trading patterns- Consolidation

Put Call Ratio : 1.06

Advances & Declines:

NSE ADVANCES : 987
NSE DECLINES : 436
BSE ADVANCES : 1998
BSE DECLINES : 944

Nifty Open Interest Changed Today:

Nifty- 5800 CE(28APR2011)- +503550(+13.09%)
Nifty- 5800 PE(28APR2011)- +689600(+15.38%)

Nifty- 5900 CE(28APR2011)- +1774750(+58.56%)
Nifty- 5900 PE(28APR2011)- +171250 (+6.47%)

Closing :-

Nifty- closed at 5,910.05(+1.60 Points & +0.03%)
Sensex- closed at 19,686.82(-14.91 Points & -0.08% )
CNX MIDCAP - closed at 8,306.00(+79.30 Points & +0.96%)
BSE SMALL CAP- closed at 8,712.92(+118.23 Points & +1.38%)

Nifty Intra Day Chart of Today:-
Just click on chart for its enlarged view
Tomorrow(06-04-2011) Outlook

As base formation between 5857-5870 today therefore this range is first support and next immediate resistance is Falling Trend line(shown in EOD chart),after this next resistance range is 6120-6180. 5911 was technical target and that has been achieved and after crossing falling trend line fast blasting rally will be seen.

2-EOD chart showing Falling Trend line
Just click on chart for its enlarged view
As selling in some pivotal stocks today therefore today range(5855-5920) will be watched first of all tomorrow and its break out will decide:


1- Next upmove after today Intra Day correction or 
2- Fresh rally after some deeper correction if Nifty slips below 5855
    
Nifty closed near the top of the day with Bullish Hammer Candle today. It is intraday correction completion signal and follow up buying tomorrow will mean fresh strong rally in the coming sessions after completion of today correction and crossing falling trend line.

FII Trading Data in Derivatives Segment on 05-Apr-2011


FII & DII trading activity in Capital Market Segment on 05-Apr-2011

FII trading activity on NSE and BSE in Capital Aprket Segment(In Rs. Crores)
CategoryDateBuy ValueSell ValueNet Value
FII05-Apr-20112204.311481.02723.29


DII trading activity on NSE and BSE in Capital Aprket Segment(In Rs. Crores)
CategoryDateBuy ValueSell ValueNet Value
DII05-Apr-2011765.691294.67-528.98

Nifty Spot-Levels & Trading Strategy for 06-04-2011

Nifty Spot-Levels

R3 6013
R2 5970
R1 5940
Avg 5897
S1 5867
S2 5824
S3 5794

Nifty Spot-Trading Strategy

H6 5983     Trgt 2
H5 5966     Trgt 1
H4 5950     Long breakout
H3 5930     Go Short
H2 5923
H1 5916
L1 5903
L2 5896
L3 5889     Long
L4 5869     Short Breakout
L5 5853     Trgt 1
L6 5836     Trgt 2

Nifty(Apr Fut)-Levels & Trading Strategy for 06-04-2011

Nifty(Apr Fut)-Levels

R3 6126
R2 6063
R1 5997
Avg 5934
S1 5868
S2 5805
S3 5739

Nifty(Apr Fut)-Trading Strategy

H6 6062     Trgt 2
H5 6032     Trgt 1
H4 6002     Long breakout
H3 5967     Go Short
H2 5955
H1 5943
L1 5920
L2 5908
L3 5896     Long
L4 5861     Short Breakout
L5 5831     Trgt 1
L6 5801     Trgt 2

Bank Nifty(Apr Fut)-Levels & Trading Strategy for 06-04-2011

Bank Nifty(Apr Fut)-Levels

R3 12145
R2 12035
R1 11948
Avg 11838
S1 11751
S2 11641
S3 11554

Bank Nifty(Apr Fut)-Trading Strategy

H6 12060     Trgt 2
H5 12014     Trgt 1
H4 11969     Long breakout
H3 11915     Go Short
H2 11897
H1 11879
L1 11842
L2 11824
L3 11806     Long
L4 11752     Short Breakout
L5 11707    Trgt 1
L6 11661     Trgt 2

Pre-closing Outlook(05-04-2011)

Very short term correction possibility predicted before opening today and that was seen today.

Following lines were told for indicting weakness of down moves in Mid-session Outlooks:-

1- Sufficient intra day selling patterns requires for any correction
2- Market slipped but without genuine selling patterns therefore today dip may be a part of condolisation also.
3- Intraday support and base formation seen between 5857-5870 today.

As I told for support and base formation and same happened, good recovery seen from lower levels. Bull rally is on and only such type of minor corrections are seen in Bull rallies.

Correction complrtion signals today and follow up buying tomorrow will mean fresh strong rallies in the coming sessions after completion of today correction.

Mid-session Outlook-2(05-04-2011)


Intraday support and base formation seen between 5857-5870 today. Sustaining beyond will be watched first immediate next move confirmations. I clearly mean to say that today begun very short term correction completion or continuation will be decided from this range:-

1- If Nifty sustains above 5870 then correction completion.
2- If Nifty sustains below 5857 then correction continuation with some depper correction posssibility.

Mid-session Outlook(05-04-2011)


As intra day correction possibility was high therefore its confirmations levels were given today and Nifty is trading in Red below 5880. Very short term correction was due and being seen today. Market slipped but without genuine selling patterns therefore today dip may be a part of condolisation also.

5854 is 1st intra day support level and will be watched for next moves confirmations. Although market slipped from higher levels but without genuine selling patterns therefore if Nifty sustains above 5854 then very short term intraday corretion completion will be considered.

Market is on wait and watch at present.

Post-open Outlook(05-04-2011)


Nifty is trading within mentioned next trend deciding range(5880-5940) since opening today. Sufficient intra day selling patterns requires for any correction and fresh consolidation within this range today will mean begining of fast rally toward 6120.Let market prepare then next decisive moves will be decided according to intra day charts patterns.

Pre-Open Market Outlook(05-04-2011)

Technical Positions,today Outlook and next possibilities have already been discussed in following topic in the Blog yesterday therefore not being repeated today:-

"Post-closing Report(04-04-2011) & Tomorrow Outlook"

Nifty gained 571 points in last 10 sessions made the top at 5918 yesterday. No intra day selling formations upto yesterday and any  correction will not be possible without this development minimum on intra day charts. As strength of this rally was understood long before therefore following lines were told:-

1- I told for rally minimum target in Post-closing Report(25-03-2011) & Monday Outlook:-

"21st March 2011 started rally minimum target is 5911"


2- For any type of down moves I told following lines in Post-closing Report(28-03-2011) & Tomorrow Outlook:-

"Complete selling patterns are required for any decisive down moves and until that will not happen till then any down move will not be imagined and after 2 months range break out any selling development can not be dreamed also."

3- I told for strength in Pre-Open Market Outlook(29-03-2011)

"Nifty will not sustain below 5580 in worst situations also."

4- I told for bullish market trading policy in Post-open Outlook(29-03-2011)

"5th wave is on and Nifty is trading within resistance range(5700-5900). Market will consolidate at higher levels without any deeper corrections in bullish markets and that will be seen. If having courage then ride on running horse otherwise if will try to stop(shorting) then be prepared for horse kick"

As no significant resistance resistance between 5900-6120 therefore fast rally between this range is a possibility also but sentiment is heated and indicators are overbought therefore intraday charts of today will be watched first for immediate next move confirmations. 5880-5940 crossing and sustaining beyond will be watched for conformation of following next possibilities:-

1- Sustaining below 5880 will mean very short term correction begining.
2- Sustaining above 5940 will mean continuation of rally without any correction as being seen in last 10 sessions.

Next immediate move will be decided after first 2/3 hours intra day charts formations today.

Post-closing Report(04-04-2011) & Tomorrow Outlook

Strong recovery and Nifty crossed crucial resistance range(5700-5900). Intra day charts of most of the Indices and pivotal stocks are showing consolidations patterns and up trend is safe today

Put Call Ratio : 1.09

Advances & Declines:-

NSE ADVANCES : 1257
NSE DECLINES : 177
BSE ADVANCES : 2454
BSE DECLINES : 473

Nifty Open Interest Changed Today:-

Nifty- 5800 CE(28APR2011)- -209950(-5.11%)
Nifty- 5800 PE(28APR2011)- +1213450(+36.21%)

Nifty- 5900 CE(28APR2011)- -582700(-15.40%)
Nifty- 5900 PE(28APR2011)- +1468150(+119.51%)

Closing :-

Nifty- closed at 5908.45(+82.40 Points & +1.41%)
Sensex- closed at 19701.73(+281.34 Points & +1.45% )
CNX MIDCAP- closed at 8226.70(+97.60 Points & +1.20%)
BSE SMALL CAP- closed at 8594.69(+236.50 Points & +2.83%)

Nifty Intra Day Chart of Today:-
Just click on chart for its enlarged view
Tomorrow(05-04-2011) Outlook:

It has been told many times that very short term indicators are overbought and sentiment is heated but until selling patterns will not develop minimum in intraday charts till then correction will not be possible. I again and again told more than 10 times for minimum 5900 and it clearly means that I am expeting levels above 5900.

Next strong resistance is between 6120-6180 but fresh consolidation is also a demand before next rally and it is expected near 5900 tomorrow and then next upmoves will begin within next 2/3 sessions. No selling formations today and if any negative news does not come out then upmoves may be seen in the last hour after some consolidations near 5900.

Nifty Spot-Levels & Trading Strategy for 05-04-2011

Nifty Spot-Levels

R3 6024
R2 5971
R1 5939
Avg 5886
S1 5854
S2 5801
S3 5769

Nifty Spot-Trading Strategy

H6 5994     Trgt 2
H5 5974     Trgt 1
H4 5954     Long breakout
H3 5931     Go Short
H2 5923
H1 5915
L1 5900
L2 5892
L3 5884     Long
L4 5861    Short Breakout
L5 5841     Trgt 1
L6 5821     Trgt 2

Nifty(Apr Fut)-Levels & Trading Strategy for 05-04-2011

Nifty(Apr Fut)-Levels

R3 6087
R2 6021
R1 5982
Avg 5916
S1 5877
S2 5811
S3 5772

Nifty(Apr Fut)-Trading Strategy

H6 6049     Trgt 2
H5 6025     Trgt 1
H4 6000     Long breakout
H3 5971     Go Short
H2 5962
H1 5952
L1 5933
L2 5923
L3 5914     Long
L4 5885     Short Breakout
L5 5860     Trgt 1
L6 5836     Trgt 2

Bank Nifty(Apr Fut)-Levels & Trading Strategy for 05-04-2011

Bank Nifty(Apr Fut)-Levels

R3 12209.00
R2 12064.00
R1 11974.00
PIVOT 11829.00
S1 11739.00
S2 11594.00
S3 11504.00

Bank Nifty(Apr Fut)-Trading Strategy

H6 12123     Trgt 2
H5 12068     Trgt 1
H4 12013     Long breakout
H3 11948    Go Short
H2 11927
H1 11905
L1 11862
L2 11840
L3 11819     Long
L4 11754     Short Breakout
L5 11699    Trgt 1
L6 11644    Trgt 2

FII Trading Data in Derivatives Segment on 04-Apr-2011

Add caption

FII & DII trading activity in Capital Market Segment on 04-Apr-2011

FII trading activity on NSE and BSE in Capital Aprket Segment(In Rs. Crores)
CategoryDateBuy ValueSell ValueNet Value
FII04-Apr-201125631958.49604.51


DII trading activity on NSE and BSE in Capital Aprket Segment(In Rs. Crores)
CategoryDateBuy ValueSell ValueNet Value
DII04-Apr-2011744.631133.96-389.33

Pre-closing Outlook(04-04-2011)


Nifty is above 5900 today and for this move I clearly told more than 10 times in last one week. Rally is very much on and no selling signals in intraday charts yet.

Pre-Open Market Outlook(04-04-2011)

All trends are up,5th wave is on,Nifty is trading within resistance range(5700-5900) with intraday consolidation patterns for the last 4 sessions. Very short term indicators are overbought and upper band of Bollinger Band is rising with Nifty rally therefore indicating technical requirements for correction.

First of all selling patterns formations in intra day charts and then correction begins and till now no selling patterns therefore any down move will not be considered. Nifty traded range bound between 5815-5840 with intra day consolidation patterns(its details has already been explained with intraday charts in last 3 topics in the Blog) therefore firstly trading between 5840-5900 will be seen after positive opening and close positive today.

Follow up buying today will pave the of strong rally above 5900 and it is also being expected.

Post-closing Report(01-04-2011) & Monday Outlook

Market is as follows after last Friday closing;-

Nifty whole day trading range- 5810-5840
Candle- Doji(confusion)
Intra day trading patterns- Condolidation

Put Call Ratio :1.23

Advances & Declines:-

NSE ADVANCES : 1145
NSE DECLINES :  278
BSE ADVANCES : 2176
BSE DECLINES :  704

Nifty Open Interest Changed:-

Nifty- 5800 CE(28APR2011)- -519850(-10.96%)
Nifty- 5800 PE(28APR2011)- +1285550(+60.57%)

Nifty- 5900 CE(28APR2011)- +1076600(+38.15%)
Nifty- 5900 PE(28APR2011)- +38700(+3.23%)

Closing :-

Nifty- closed at 5826.05(-7.70  Points & -0.13%)
Sensex- closed at 19420.39(-24.83 Points & -0.13% )
CNX MIDCAP - closed at 8129.10 (+88.95 Points & +1.11%)
BSE SMALL CAP- closed at 8358.19(+182.30 Points & +2.23%)

Nifty Intra Day Chart f  of  01-04-2011:-
Just click on chart for its enlarged view
Monday(01-04-2011) Outlook

5th impulsive wave is on and all trends are up.

SENSEX and Nifty closed in Red last Friday  but it is clear from Advances & Declines that broader market was positive as well as CNX MIDCAP and BSE SMALL CAP closed with good gains on Friday. Nifty intraday chart is also suggesting consolidation pattern therefore expected that Nifty will not sustain below last Fridy range and finally fresh up moves will restart within 2/3 sessions. Short term indicators are overbought and heated very short term correction may be possible.