

ॐ ह्रीं श्रीं लक्ष्मीभयो नमः॥

FII & DII trading activity in Capital Market Segment on 12-Jul-2013
| ||||||||||||||||
| ||||||||||||||||
Indian Stock Markets Closing Reports(12-Jul-2013)
Main features of today trading are as follows
RatiosIndex Options Put Call Ratio: 1.32
Total Options Put Call Ratio: 1.21
Nifty P/E Ratio(12-Jul-2013): 18.31
Nifty P/B Ratio(12-Jul-2013): 3.08
Dividend Yield (12-Jul-2013): 1.38
Advances & Declines
BSE Advances : 1,067
BSE Declines : 1,243
NSE Advances : 613
NSE Declines : 725
Nifty Open Interest Changed Today
Nifty- 5800 CE(Jul)- -435,000(-12.0%)
Nifty- 5800 PE(Jul)- 892,300(12.2%)
Nifty- 5900 CE(Jul)- -390,700(-8.9%)
Nifty- 5900 PE(Jul)- 2,363,750(56.0%)
Nifty- 6000 CE(Jul)- -1,003,900(-14.5%)
Nifty- 6000 PE(Jul)- 1,302,950(50.1%)
Nifty- 6100 CE(Jul)- 577,400(12.5%)
Nifty- 6100 PE(Jul)- 287,150(42.9%)
Closing
Sensex- closed at 19958(282.41 Points & 1.44%)
Nifty- closed at 6,009.00(73.90 Points & 1.25%)
CNX Midcap - closed at 7,459.70(21.60 Points & 0.29%)
CNX Smallcap- closed at 2,961.85(-3.80 Points & -0.13%)
Nifty Spot-Levels & Trading Strategy for 15-07-2013
Nifty Spot-Levels
R3 6103
R2 6061
R1 6035
Avg 5993
S1 5967
S2 5925
S3 5899
Nifty Spot-Trading Strategy
H6 6077 Trgt 2
H5 6062 Trgt 1
H4 6046 Long breakout
H3 6027 Go Short
H2 6021
H1 6015
L1 6002
L2 5996
L3 5990 Long
L4 5971 Short Breakout
L5 5955 Trgt 1
L6 5940 Trgt 2
R3 6103
R2 6061
R1 6035
Avg 5993
S1 5967
S2 5925
S3 5899
Nifty Spot-Trading Strategy
H6 6077 Trgt 2
H5 6062 Trgt 1
H4 6046 Long breakout
H3 6027 Go Short
H2 6021
H1 6015
L1 6002
L2 5996
L3 5990 Long
L4 5971 Short Breakout
L5 5955 Trgt 1
L6 5940 Trgt 2
Nifty(Jul Fut)-Levels & Trading Strategy for 15-07-2013
Nifty(Jul Fut)-Levels
R3 6105
R2 6063
R1 6035
Avg 5993
S1 5965
S2 5923
S3 5895
Nifty(Jul Fut)-Trading Strategy
H6 6077 Trgt 2
H5 6061 Trgt 1
H4 6045 Long breakout
H3 6026 Go Short
H2 6019
H1 6013
L1 6000
L2 5994
L3 5987 Long
L4 5968 Short Breakout
L5 5952 Trgt 1
L6 5936 Trgt 2
R3 6105
R2 6063
R1 6035
Avg 5993
S1 5965
S2 5923
S3 5895
Nifty(Jul Fut)-Trading Strategy
H6 6077 Trgt 2
H5 6061 Trgt 1
H4 6045 Long breakout
H3 6026 Go Short
H2 6019
H1 6013
L1 6000
L2 5994
L3 5987 Long
L4 5968 Short Breakout
L5 5952 Trgt 1
L6 5936 Trgt 2
Bank Nifty(Jul Fut)-Levels & Trading Strategy for 15-07-2013
Bank Nifty(Jul Fut)-Levels
R3 12114
R2 11984
R1 11862
Avg 11732
S1 11610
S2 11480
S3 11358
Bank Nifty(Jul Fut)-Trading Strategy
H6 11995 Trgt 2
H5 11936 Trgt 1
H4 11878 Long breakout
H3 11809 Go Short
H2 11786
H1 11763
L1 11716
L2 11693
L3 11670 Long
L4 11601 Short Breakout
L5 11543 Trgt 1
L6 11485 Trgt 2
R3 12114
R2 11984
R1 11862
Avg 11732
S1 11610
S2 11480
S3 11358
Bank Nifty(Jul Fut)-Trading Strategy
H6 11995 Trgt 2
H5 11936 Trgt 1
H4 11878 Long breakout
H3 11809 Go Short
H2 11786
H1 11763
L1 11716
L2 11693
L3 11670 Long
L4 11601 Short Breakout
L5 11543 Trgt 1
L6 11485 Trgt 2
Nifty Spot-Weekly Levels & Trading Strategy(Jul 15 to Jul 19,2013)
Nifty Spot-Weekly Levels
R3 6336
R2 6177
R1 6093
Avg 5934
S1 5850
S2 5691
S3 5607
Nifty Spot-Weekly Trading Strategy
H6 6261 Trgt 2
H5 6202 Trgt 1
H4 6142 Long breakout
H3 6075 Go Short
H2 6053
H1 6031
L1 5986
L2 5964
L3 5942 Long
L4 5875 Short Breakout
L5 5815 Trgt 1
L6 5756 Trgt 2
R3 6336
R2 6177
R1 6093
Avg 5934
S1 5850
S2 5691
S3 5607
Nifty Spot-Weekly Trading Strategy
H6 6261 Trgt 2
H5 6202 Trgt 1
H4 6142 Long breakout
H3 6075 Go Short
H2 6053
H1 6031
L1 5986
L2 5964
L3 5942 Long
L4 5875 Short Breakout
L5 5815 Trgt 1
L6 5756 Trgt 2
Bank Nifty Spot-Weekly Levels & Trading Strategy(Jul 15 to Jul 19,2013)
Bank Nifty Spot-Weekly Levels
R3 12483
R2 12113
R1 11917
Avg 11547
S1 11351
S2 10981
S3 10785
Bank Nifty Spot-Weekly Trading Strategy
H6 12315 Trgt 2
H5 12174 Trgt 1
H4 12033 Long breakout
H3 11877 Go Short
H2 11825
H1 11773
L1 11670
L2 11618
L3 11566 Long
L4 11410 Short Breakout
L5 11269 Trgt 1
L6 11128 Trgt 2
R3 12483
R2 12113
R1 11917
Avg 11547
S1 11351
S2 10981
S3 10785
Bank Nifty Spot-Weekly Trading Strategy
H6 12315 Trgt 2
H5 12174 Trgt 1
H4 12033 Long breakout
H3 11877 Go Short
H2 11825
H1 11773
L1 11670
L2 11618
L3 11566 Long
L4 11410 Short Breakout
L5 11269 Trgt 1
L6 11128 Trgt 2
Mid-session Outlook(12-07-2013)
Strong resistance range(5873-5969) was lying at higher levels and Nifty traded within and little above it amid most Bullish news based 2 sessions(yesterday and today. Nifty whole day hovered around 5969 and trade between 5952-5992 with mixed trading patterns because today intraday chart is showing buying but that is only on the back of INFY therefore confirmation is required.
Although good selling below 5900 in previous sessions but yesterday rally seen on the back of Global all financial markets strong up moves and today up moves are also INFY results generated therefore next up moves confirmation is firstly required through sustaining above 5969 and should be firstly watched in next week despite Nifty is trading at 5990 at this moment.
Although good selling below 5900 in previous sessions but yesterday rally seen on the back of Global all financial markets strong up moves and today up moves are also INFY results generated therefore next up moves confirmation is firstly required through sustaining above 5969 and should be firstly watched in next week despite Nifty is trading at 5990 at this moment.
Post-open Outlook(12-07-2013)
Gap up strong opening after INFY good results today and Nifty is trading below the high of the immediate resistance(5969) after fast slipping from higher levels. 2 sessions trading is completely news based and finally sustaining above immediate resistance range(5873-5969) will mean positive reaction on news and only then rally will be seen after confirmation of worst is over.
Although positive news flow but sustaining beyond mentioned resistance range(5873-5969) should be firstly watched for next trend confirmations.
Technical Analysis and Market Outlook(12-07-2013)
Nifty-Intra Day Chart (11-Jul-2013):-
Technical Patterns and Formations in today intraday charts
1- Most time trading between 5923-5947 with higher levels selling patterns formations
2- Whole day actual trading between 5903-5947
Blasting Global cues led gap up opening and whole day trading between strong resistances(5873-5969) as well as most time trading between 5923-5947 with higher levels selling patterns formations. As today trading was after huge gap up opening therefore mentioned selling patterns will be understood only first indication of weakness and follow up moves with sustaining beyond mentioned strong resistance range should be firstly watched for next trend confirmations.
 |
| Just click on chart for its enlarged view |
1- Most time trading between 5923-5947 with higher levels selling patterns formations
2- Whole day actual trading between 5903-5947
Conclusions from intra day chart analysis
Blasting Global cues led gap up opening and whole day trading between strong resistances(5873-5969) as well as most time trading between 5923-5947 with higher levels selling patterns formations. As today trading was after huge gap up opening therefore mentioned selling patterns will be understood only first indication of weakness and follow up moves with sustaining beyond mentioned strong resistance range should be firstly watched for next trend confirmations.
5873-5969 is next Trend decider
Pre-Closing Outlook(11-07-2013)
As today all Global financial markets up moves are fabricated news generated and manipulated as well therefore next trend will be decided after cooling down of markets tomorrow.
Multiple strong resistances are at higher levels between 5873-5969 and it was told in previous Outlooks as well as Nifty is trading within this range since opening today. As technical doesn't work too much in such news based markets therefore no final conclusion can be drawn from today trading patterns formations.
Truth of today up moves will come out after sustaining beyond mentioned strong resistances range(5873-5969) and should be firstly watched in the coming sessions.
Global Financial Markets Manipulations
Post-open Outlook(11-07-2013)
Big irony that all Global financial markets crashed after FOMC meet on 19-06-2013 but all blasted today after the announcement of its minutes,it is beyond understanding that how the minutes of a meeting and its markets reactions can be so adverse of its decisions. Also surprising that no reaction of FOMC minutes on US markets yesterday and flat closing seen there but its Futures turned almost 1% up within 3 hours of US markets closing.
I would say it is only US generated global financial markets manipulations and traders should form trading policies to counter such highly manipulated situations also.
Certainly complete Global markets manipulations and now Nifty is trading within strong resistance range(5873-5969),firstly valid break out of this range should be watched for next trend confirmations.
Pre-open Outlook(11-07-2013)
Our view was Bearish and Indian markets closed near the lows of yesterday but Asian markets are blasting today because Dow's Futures is more than 120 points up today despite US and European markets flat closing yesterday. Indian markets slipped yesterday after higher levels very good selling in previous sessions and multiple strong resistances are lying at higher levels between 5873-5969.
As sentiment suddenly turned strong today therefore expected that Nifty will firstly trade within mentioned resistance range after gap up opening. Today up moves will be only Global sentiments generated and its sustainability within mentioned resistance range as well as intraday charts formations will be firstly watched and will be updated accordingly in Mid-session Outlooks.
As sentiment suddenly turned strong today therefore expected that Nifty will firstly trade within mentioned resistance range after gap up opening. Today up moves will be only Global sentiments generated and its sustainability within mentioned resistance range as well as intraday charts formations will be firstly watched and will be updated accordingly in Mid-session Outlooks.
Technical Analysis and Market Outlook(11-07-2013)
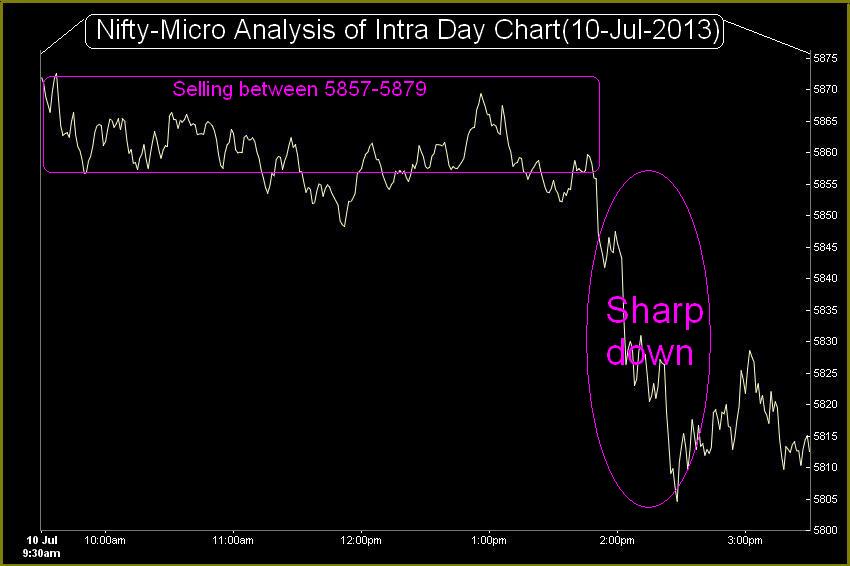
Nifty-Intra Day Chart (10-Jul-2013):-
Technical Patterns and Formations in today intraday charts
1- Selling between 5857-5879
2- Sharp down
3- Whole day actual trading between 5804-5879
Firstly more than 4 hours selling within narrow range market and after that range broken down force fully as well as closing near the lower levels of the day today. Correction is very much on and its continuation is expected in the coming sessions.
Although correction was seen today but we are continuously daily telling its possibility since Monday in following topics:_
1-On 08-07-2013- High possibility of Corrective Wave-C continuation( Weekly Outlook
(Jul 08 to Jul 12,2013))
2-On 09-07-2013- Firstly Sideways market and Finally Wave-C correction continuation
3-On 10-07-2013- Technical Analysis and Market Outlook(10-07-2013)
4-On 10-07-2013- Pre-open Outlook(10-07-2013)
 |
| Just click on chart for its enlarged view |
1- Selling between 5857-5879
2- Sharp down
3- Whole day actual trading between 5804-5879
Conclusions from intra day chart analysis
Firstly more than 4 hours selling within narrow range market and after that range broken down force fully as well as closing near the lower levels of the day today. Correction is very much on and its continuation is expected in the coming sessions.
Although correction was seen today but we are continuously daily telling its possibility since Monday in following topics:_
1-On 08-07-2013- High possibility of Corrective Wave-C continuation( Weekly Outlook
(Jul 08 to Jul 12,2013))
2-On 09-07-2013- Firstly Sideways market and Finally Wave-C correction continuation
3-On 10-07-2013- Technical Analysis and Market Outlook(10-07-2013)
4-On 10-07-2013- Pre-open Outlook(10-07-2013)
Just click above 4 topic links and understand technical reasons of on going correction.
Live Proofs of Indian Stock Markets 100% Accurate Predictions
Following lines were told today at 02:44 AM in Technical Analysis and Market Outlookexpected that Nifty will not sustain above yesterday highest(5864) and will finally slip 5864 and correction will remain continued in the coming couple of sessions.
Following lines were told today at 07:12 AM in Pre-open Outlook
expected that Indian markets will not sustain at higher levels and correction will remain continued after follow up selling in the couple of sessions.
When all the US and European markets closed strong yesterday and most Asian markets were trading with good gains as well as SGX Nifty was trading more than 25 points up then Correction continuation was told during such Bullish mood which proved 100% accurate today
Not only today but 'Archive' at the bottom of Blog' is live proof of more than hundreds of such accurate and miraculous predictions in last 3 years. Anyone can verify this facts anytime from the Blog 'Archive'
Pre-open Outlook(10-07-2013)
As US and European markets closed with good gains yesterday and most Asian markets are up today morning therefore positive zone trading is expected after Green opening in Indian markets today. Multiple strong resistances are at higher levels between 5873-5969 and intraday selling patterns formations seen yesterday therefore expected that Indian markets will not sustain at higher levels and correction will remain continued after follow up selling in the couple of sessions.
Technical Analysis and Market Outlook(10-07-2013)
Nifty-Intra Day Chart (09-Jul-2013):-
Technical Patterns and Formations in today intraday charts
1- Both buying and selling indications.
2- Whole day intraday pattern is showing selling patterns formations.
3- Whole day actual trading between 5835-5864
Conclusions from intra day chart analysis
Whole day sideways trading between 5835-5864 with both buying and selling indications but whole day intraday pattern is showing selling patterns formations therefore expected that Nifty will not sustain above yesterday highest(5864) and will finally slip 5864 and correction will remain continued in the coming couple of sessions.
 |
| Just click on chart for its enlarged view |
1- Both buying and selling indications.
2- Whole day intraday pattern is showing selling patterns formations.
3- Whole day actual trading between 5835-5864
Conclusions from intra day chart analysis
Whole day sideways trading between 5835-5864 with both buying and selling indications but whole day intraday pattern is showing selling patterns formations therefore expected that Nifty will not sustain above yesterday highest(5864) and will finally slip 5864 and correction will remain continued in the coming couple of sessions.

FII & DII trading activity in Capital Market Segment on 09-Jul-2013
| ||||||||||||||||
| ||||||||||||||||
Nifty Spot-Levels & Trading Strategy for 10-07-2013
Nifty Spot-Levels
R3 5900
R2 5882
R1 5870
Avg 5852
S1 5840
S2 5822
S3 5810
Nifty Spot-Trading Strategy
H6 5889 Trgt 2
H5 5882 Trgt 1
H4 5875 Long breakout
H3 5867 Go Short
H2 5864
H1 5861
L1 5856
L2 5853
L3 5850 Long
L4 5842 Short Breakout
L5 5835 Trgt 1
L6 5828 Trgt 2
R3 5900
R2 5882
R1 5870
Avg 5852
S1 5840
S2 5822
S3 5810
Nifty Spot-Trading Strategy
H6 5889 Trgt 2
H5 5882 Trgt 1
H4 5875 Long breakout
H3 5867 Go Short
H2 5864
H1 5861
L1 5856
L2 5853
L3 5850 Long
L4 5842 Short Breakout
L5 5835 Trgt 1
L6 5828 Trgt 2
Nifty(Jul Fut)-Levels & Trading Strategy for 10-07-2013
Nifty(Jul Fut)-Levels
R3 5916
R2 5896
R1 5882
Avg 5862
S1 5848
S2 5828
S3 5814
Nifty(Jul Fut)-Trading Strategy
H6 5902 Trgt 2
H5 5894 Trgt 1
H4 5886 Long breakout
H3 5877 Go Short
H2 5874
H1 5871
L1 5864
L2 5861
L3 5858 Long
L4 5849 Short Breakout
L5 5841 Trgt 1
L6 5833 Trgt 2
R3 5916
R2 5896
R1 5882
Avg 5862
S1 5848
S2 5828
S3 5814
Nifty(Jul Fut)-Trading Strategy
H6 5902 Trgt 2
H5 5894 Trgt 1
H4 5886 Long breakout
H3 5877 Go Short
H2 5874
H1 5871
L1 5864
L2 5861
L3 5858 Long
L4 5849 Short Breakout
L5 5841 Trgt 1
L6 5833 Trgt 2
Bank Nifty(Jul Fut)-Levels & Trading Strategy for 10-07-2013
Bank Nifty(Jul Fut)-Levels
R3 11634
R2 11567
R1 11524
Avg 11457
S1 11414
S2 11347
S3 11304
Bank Nifty(Jul Fut)-Trading Strategy
H6 11592 Trgt 2
H5 11567 Trgt 1
H4 11542 Long breakout
H3 11512 Go Short
H2 11502
H1 11492
L1 11471
L2 11461
L3 11451 Long
L4 11421 Short Breakout
L5 11396 Trgt 1
L6 11371 Trgt 2
R3 11634
R2 11567
R1 11524
Avg 11457
S1 11414
S2 11347
S3 11304
Bank Nifty(Jul Fut)-Trading Strategy
H6 11592 Trgt 2
H5 11567 Trgt 1
H4 11542 Long breakout
H3 11512 Go Short
H2 11502
H1 11492
L1 11471
L2 11461
L3 11451 Long
L4 11421 Short Breakout
L5 11396 Trgt 1
L6 11371 Trgt 2
Pre-Closing Outlook(09-07-2013)
Whole day sideways trading between 5835-5864 which is just below next resistance range(5873-5900). As both buying and selling indications seen today therefore no confirmation yet and it will be safer to get confirmations through valid break out of 5775-5900.
Mid-session Outlook-3(09-07-2013)
When Indian markets were continuously slipping and trading near the lowest of the today then we were not Bearish and clearly told following lines in both previous Outlooks:-
1- now trading near the lowest levels of today but no as such selling patterns in intraday charts of today
2- slipping from higher levels after gap up opening but no as such selling patterns formations
As no clear selling pattern formation therefore now Nifty is trading near the top of today after emergence of consolidation indications also therefore firstly valid break out of 5775-5900 should be watched for next trend first strong indication.
Mid-session Outlook-2(09-07-2013)
Although continuously slipping from higher levels after gap up opening but no as such selling patterns formations therefore no confirmation yet and firstly valid break out of 5775-5900 should be watched for next trend first strong indication.
Mid-session Outlook(09-07-2013)
Slipping continuously after gap up opening and now trading near the lowest levels of today but no as such selling patterns in intraday charts of today therefore view is watchful and waiting for clear patterns formations,let it happen then will be updated accordingly.
Firstly Sideways market and Finally Wave-C correction continuation
Technical Analysis and Market Outlook
(09-07-2013)
Nifty-Intra Day Chart (08-Jul-2013):-
 |
| Just click on chart for its enlarged view |
1- Support between 5775-5795
2- Up moves with intraday corrections.
3- Whole day actual trading between 5775-5831
Conclusions from intra day chart analysis
Firstly slipping from higher levels but lower levels supports and up moves with intraday correction therefore possibility of some up moves in the coming session. Next immediate resistances are as follows:-
1- 5831-5843
2- 5873-5900
3- 5900-5969
Next immediate supports are as follows:-
1- 5775-5810
2- 5762-5781
3- 5566-5650
Corrective Wave-C continuation with lower levels strong supports and higher levels good resistances also therefore following conclusive line was told in Technical Analysis and Market Outlook(04-07-2013) and Technical Analysis and Market Outlook(05-07-2013) and being repeated:-
sideways broader range market between 5762-5969 will be considered
Expected that firstly Nifty trade between 5762-5969 in the coming sessions and prepare for next moves. Follow up selling and sustaining below 5762 will mean sharp fall toward 5566 and its possibility is turning higher now despite recovery from lower levels yesterday because Wave-C correction is continued.
High possibility of Corrective Wave-C continuation
Technical Analysis,Research & Weekly Outlook
(Jul 08 to Jul 12,2013)
Nifty-Intra Day Chart (05-Jul-2013):- |
| Just click on chart for its enlarged view |
1- Firstly 3 hours selling between 5873-5900
2- Almost 3 hours trading between 5859-5882 with mixed intraday patterns formations
3- Whole day actual trading between 5859-5900
Conclusions from intra day chart analysis
As firstly 3 hours selling between 5873-5900 therefore slipping below 5873 and after that almost 3 hours trading between 5859-5882 with mixed intraday patterns formations therefore sustaining beyond 5859-5900 should be firstly watched in the coming sessions for next trend first strong indication.
Nifty-EOD Chart (05-Jul-2013):-
 |
| Just click on chart for its enlarged view |
1- Wave-5 top formation at 6229.45 on 20-05-2013 and 5 waves correction continuation
2- Wave 1(5936.80 on 24-05-2012)
3- Wave 2(6133.75 on 30-05-2012)
4- Wave 3(5683.10 on 13-06-2013)
5- Wave 4(5863.40 on 13-06-2013)
6- Wave-5(5566.25 on 24-06-2013) and corrective Wave-A completion.
7- Strong Pull Back and high formation at 5904.35 on 01-07-2013 and corrective Wave-B completion.
8- Strong resistances between 5900-5969
9- 50% Fibonacci Retracement level at 5897
10- Lower top formation at 5900.45 on 05-07-2013
Conclusions (After Putting All Indicators Together)
Strong resistances were between 5900-5969(updated many times in previous week) and high formation at 5904.35 on 01-07-2013 in previous week as well as market could not sustain at higher levels after selling development. Although some recovery also seen in previous week but higher levels selling again developed between 5873-5900 on 05-07-2013.
50% Fibonacci Retracement level at 5897 which is just below next strong resistances(5900-5969). As 2 times follow up selling just below both crucial levels therefore high possibility of Corrective Wave-C continuation after Wave-B completion in previous week.
Certainly Long Term Trend is at stake therefore firstly sustaining beyond 200-Day EMA(today at 5765) should be firstly watched in the coming week. It should be mind that once Corrective Wave-C continuation confirmation will mean much deeper correction and sustaining beyond following supports should be firstly watched:-
1- 5787-5810
2- 5762-5781
Subscribe to:
Posts (Atom)