

Finally 2 crucial levels will confirm
next trend formations & life/length
of on going "ABC" correction
Technical Analysis,Research & Weekly
Outlook(Feb 10 to Feb 14,2025)
Nifty-EOD Chart Analysis
(Waves structure)
Nifty-EOD Chart (07-Feb-2025):-

Technical Patterns and Formations in EOD charts
1- Wave-C of Wave-(ii) of Wave-3 completion at 18837.80 on 26-10-2023 and impulsive Wave-(iii) of Wave-3 beginning.
2- Impulsive Wave-(iii) of Wave-3 completion with new life time top formations at 26277.30 on 27-09-2024 and Corrective Wave-A of Wave-(iv) of Wave-3 of "ABC" correction beginning.
3- Corrective Wave-A of Wave-(iv) of Wave-3 completion at 23263.20 on 21-11-2024.
4- Corrective Wave-B of Wave-(iv) of Wave-3 completion at 24857.80 on 05-12-2024.
5- Corrective Wave-C of Wave-(iv) of Wave-3 continuation with recent bottom formations at 22786.9 on 27-01-2025.
6- Previous 14 Sessions from 13-01-2025 to 30-01-2025 trading was between 22787-23426 and this trading range was forcefully broken out to 31-01-2025.
7- Pull Back rally continuation with recent top formations at 23807.3 on 05-02-2025.
Conclusions from EOD chart analysis
(Waves structure)
Corrective Wave-C of Wave-(ii) of Wave-3 of "ABC" correction completed at 18837.80 on 26-10-2023 and from this level impulsive Wave-(iii) of Wave-3 started which completed at 26277.30 on 27-09-2024 after gaining 7439.5 points in 11 months and new life time top formations at this level.
Corrective Wave-A of "ABC" correction of Wave-(iv) of Wave-3 begun from this level which completed at 23263.20 on 21-11-2024 and from this level Wave-B of Wave-(iv) of Wave-3 started which completed at 24857.80 on 05-12-2024. Corrective Wave-C of Wave-(iv) of Wave-3 begun from this level which is now in continuation with recent bottom formations at 22786.9 on 27-01-2025 and no confirmation of its completion yet on EOD charts. Pull Back rally started from this level which is now in continuation with recent top formations at 23807.3 on 05-02-2025 and no confirmation of its completion also on EOD charts.
Nifty-EOD Chart Analysis
(Stochastic & MACD)
Nifty-EOD Chart (07-Feb-2025):-

Technical Patterns and Formations in EOD charts
1- Stochastic- Its both lines %K(5) and %D(3) are kissing in Over bought zone.
2- Stochastic:- %K(5)- 83.57 & %D(3)- 82.42.
3- In MACD- MACD line has intersected Average line upward and its both lines are rising in positive and negative zone.
4- MACD(26,12)- 599.93 & EXP(9)- -157.10 & Divergence- 757.03
Conclusions from EOD chart analysis
(Stochastic & MACD)
Technical positions of Short Term indicators are as follows:-
1- As in Stochastic its both lines %K(5) and %D(3) are kissing in Over bought zone therefore it will be understood that at present this indicator is not showing clear signals of Short Term downward moves beginning. Let its both lines to start downward moves after %K(5) line downward intersection of %D(3) line then Short Term correction will be seen.
2- As in MACD its MACD line has intersected Average line upward and its both lines are rising in positive and negative zone therefore it will be understood that this indicator has started to show Upward Trend formations signals. Let its both lines to move up in Positive zone then decisive upward moves will be seen after upward trend formation confirmations.
Nifty-EOD Chart Analysis
(Averages)
Nifty-EOD Chart (07-Feb-2025):-
Technical Patterns and Formations in EOD charts
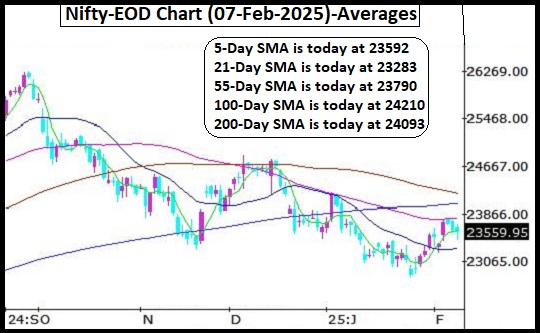
Averages:-
1- 5-Day SMA is today at 23592
2- 21-Day SMA is today at 23283
3- 55-Day SMA is today at 23790
4- 100-Day SMA is today at 24210
5- 200-Day SMA is today at 24093
Conclusions from EOD chart analysis
(Averages)
As Nifty is sustaining above Short Term Trend decider 21-Day SMA therefore it will be understood that now Short Term Trend is up but Intermediate Term Trend is stake because Nifty is hovering just below its decider 55-Day SMA for the last 4 sessions. Firstly sustaining beyond 55-Day SMA should be watched in the coming week/weeks because:-
1- If Nifty sustains above 55-Day SMA then strong up moves will be seen and then testing possibility of Long Term Trend decider 200-Day SMA can not be ruled out because it is now less than 500 points above Intermediate Term Trend decider 55-Day SMA.
2- If finally Nifty fails to sustain above 55-Day SMA then decisive downward moves will be seen towards Short Term Trend decider 21-Day SMA which is now 507 points below Intermediate Term Trend decider 55-Day SMA.
Nifty-Last 4 Sessions intraday
charts analysis
Nifty-Intra Day Chart (Feb 04 to Feb 07,2025):-

Technical Patterns formation in last 4 Sessions intraday charts
1- Selling(Resistances) in last 4 Sessions are as follows:-
A- 23745-23807
2- Consolidation(Supports) in last 4 Sessions are as follows:-
A- 23444-23517
B- 23424-23559
C- 23382-23423(Gap Supports)
3- Last 4 Sessions actual trading between 23424-23807
Conclusions from 4 Sessions
intra day chart analysis
Nifty opened 41 points gap up(23382-23423) on 04-02-2025 and after that traded last 4 Sessions between 23424-23807 with above mentioned supports and resistances. Although Nifty closed at the top of of last 3 supports and next resistances from 23745 are 146 points above from this level but there are lower levels 3 supports are higher levels only 1 resistance is lying therefore Nifty will firstly trade and prepare for next trend and bigger moves within and near about last 4 sessions trading range in the coming week. As finally sustaining beyond this last 4 sessions trading range will form next trend and generate bigger moves also therefore it should be firstly watched in the coming week for confirmations.
Nifty-Intra Day Chart Analysis
(07-Feb-2025)
Nifty-Intra Day Chart (07-Feb-2025):-

Technical Patterns formation in today intraday charts
1- RBI Moneytary Policy led volatility in first 3 hours between 23497-23694
2- 250 Points down moves in Mid-Session
3- Consolidation between 23444-23517
4- Sharp up in last hour
5- Whole day actual trading between 23444-23517
Conclusions from intra day
chart analysis
Although Green opening last Friday and after that RBI Monetary committee announcements led high volatility was seen in 3 hours but Nifty could not sustain at higher levels and 250 Points down moves developed in Mid-Session as well as Nifty traded 160 points down also in last hour. As lower levels consolidation was also seen in last 2 hours therefore firstly upward moves are expected towards next resistances(23745-23807) in the beginning of next week.
Conclusions from intra day chart analysis
Although Green opening last Friday and after that RBI Monetary committee announcements led high volatility was seen in 3 hours but Nifty could not sustain at higher levels and 250 Points down moves developed in Mid-Session as well as Nifty traded 160 points down also in last hour. As lower levels consolidation was also seen in last 2 hours therefore firstly upward moves are expected towards next resistances(23745-23807) in the beginning of next week.
Conclusions (After putting
all studies together)
1- Long Term Trend is down.
2- Intermediate Term Trend is at stake.
3- Short Term Trend is up.
Impulsive Wave-(iii) of Wave-3 which started from 18837.80 on 26-10-2023 gained 7439.5 points in 11 months and formed new life time top also at this level before completion at 26277.30 on 27-09-2024 and from this level corrective Wave-A of Wave-(iv) of Wave-3 of "ABC" correction begun. Now its corrective Wave-C of Wave-(iv) of Wave-3 is in continuation with its recent bottom formations at 22786.90 on 27-01-2025 after loosing 3490 points in the last 4 months.
Short Term indicators have started to show upward trend formations signals through MACD because now its both lines are rising in positive and negative zone. Although in Stochastic its both lines %K(5) and %D(3) are kissing in Over bought zone but it has not shown clear signals of short term downward moves beginning therefore some more upward moves can not be ruled out in the coming week.
As finally sustaining beyond Intermediate Term Trend decider 55-Day SMA will generate strong signals of next trend therefore it should be firstly watched because once sustaining above it will mean upward moves beginning for 3 weeks to 3 months and in that situation Nifty may test Long Term Trend decider 200-Day SMA which is now less than 500 points above Intermediate Term Trend decider 55-Day SMA. It should also be kept in mind that once sustaining above 200-Day SMA will mean strong rally beginning after on going "ABC" correction completion confirmations.
14 Sessions trading from 13-01-2025 to 30-01-2025 was between 22787-23426 and this trading range was forcefully broken out just one day before Union Budget-2025 on 31-01-2025. Nifty traded above this range also in the last 4 sessions of previous week between 23424-23807 with above mentioned supports and resistances therefore firstly sustaining beyond this range should be watched in the coming week/weeks because it will generate first strong signal of next trend formations. Finally sustaining beyond following 2 crucial levels will confirm next trend formation and life/length of on going "ABC" correction also:-
1- 14 Sessions trading range highest(23426) because sustaining above it will mean strong rally beginning after valid break out of 14 sessions like bigger trading range(22787-23426) and sustaining below it will mean invalid break out of 14 Sessions trading Highest(23426) and after that deeper correction beginning will be seen.
2- 55-Day SMA(today at 23790) because finally 500 points moves above or below it will confirm all the trends turning up or down.


