As whole day intraday charts formations are suggesting selling formations therefore more down moves are expected in the next week and Nifty may slip below 5000 also in next week.

ॐ ह्रीं श्रीं लक्ष्मीभयो नमः॥

Pre-Closing Outlook(21-10-2011)
As whole day intraday charts formations are suggesting selling formations therefore more down moves are expected in the next week and Nifty may slip below 5000 also in next week.
Mid-session Outlook-3(21-10-2011)
Although support also seen at lower levels after higher level selling but whole day intraday charts formations are suggesting selling formations therefore down moves are expected in the next week.
Mid-session Outlook-2(21-10-2011)
As soon as selling signals seen then it updated in Mid-session Outlook and markets slipped fast after our message. Although 5108-5125 broken down but strong supports between 5012-5050 therefore complete selling is required to move below 5012.
Next moves preparation and trading range is 5050-5108 and intraday support signals also emerged at lower levels today. Mixed signals today therefore let market ripe for next moves within today trading range(5072-5120) then final conclusions will be drawn from intraday patterns formations and its break out.
Next moves preparation and trading range is 5050-5108 and intraday support signals also emerged at lower levels today. Mixed signals today therefore let market ripe for next moves within today trading range(5072-5120) then final conclusions will be drawn from intraday patterns formations and its break out.
Mid-session Outlook(21-10-2011)
Market is positive but selling signals seen therefore keep in mind and watch sustaining beyond 5108-5125 for confirmations.
Post-open Outlook(21-10-2011)
Strong support developed between 5012-5155 in last 6 sessions and complete selling formations are required to move below 5012.
Nifty traded 3 Hours with mixed intra day patterns between 5108-5125 on 17-10-2011 and again same trading on 19-10-2011. Total 6 hours trading with mixed intra day patterns between 5108-5125 in 2 sessions and finally sustaining beyond this range will be next moves confirmations.
Just watch sustaining beyond 5108-5125 for next big moves confirmations.
Technical Analysis and Research For 21-10-2011
Nifty-Intra Day Chart(20-Oct-2011):-
Technical Patterns and Formations in today intraday charts
1- Down moves in Falling Channel.
2- Consolidation between 5034-5050.
3- Last 2 hours up moves between 5053-5097.
4- Whole day trading between 5034-5097.
Conclusions
On going pull back rally started on 05-10-2011 and its correction begun from 5160 after 8 sessions as well as good support also seen between 5012-5035 on 18-10-2011. As Global markets were bleeding therefore Indian markets dipped sharply after weak opening but again good intraday support and base formation seen between 5034-5050 today.
Huge violent volatility in Global markets nowadays therefore trading levels will be finalised accoring to global mood and sentiment tomorrow morning. Dow Jones is more than 110 points down after European markets near about 2% down closing but in Indian markets good support and base formation at lower levels(5012-5050) in last 6 sessions therefore expected that indian markets will remain range bound between 5012-5155.
Although Indian markets could not sustain at higher levels in last 6 corrective sessions but selling are not strong at higher levels therefore 5012-5155 break out should be watched for next moves confirmations despite whatsoever depressing global markets because good support and base formation between 5012-5050 also.
 |
| Just click on chart for its enlarged view |
1- Down moves in Falling Channel.
2- Consolidation between 5034-5050.
3- Last 2 hours up moves between 5053-5097.
4- Whole day trading between 5034-5097.
Conclusions
On going pull back rally started on 05-10-2011 and its correction begun from 5160 after 8 sessions as well as good support also seen between 5012-5035 on 18-10-2011. As Global markets were bleeding therefore Indian markets dipped sharply after weak opening but again good intraday support and base formation seen between 5034-5050 today.
Huge violent volatility in Global markets nowadays therefore trading levels will be finalised accoring to global mood and sentiment tomorrow morning. Dow Jones is more than 110 points down after European markets near about 2% down closing but in Indian markets good support and base formation at lower levels(5012-5050) in last 6 sessions therefore expected that indian markets will remain range bound between 5012-5155.
Although Indian markets could not sustain at higher levels in last 6 corrective sessions but selling are not strong at higher levels therefore 5012-5155 break out should be watched for next moves confirmations despite whatsoever depressing global markets because good support and base formation between 5012-5050 also.
Indian Stock Markets Closing Reports(20-Oct-2011)
Main features of today trading are as follows
1- Red closing even after good recovery from lower levels.
2- Bullish Hammer candle.
3- All the Indices closed in Red except IT.
4- Good support and base formation at lower levels today.
Ratios
Nifty Put Call Ratio: 1.06
Nifty P/E Ratio(20-Oct-2011): 18.14
Advances & Declines
BSE ADVANCES : 1106
BSE DECLINES : 1713
NSE ADVANCES : 495
NSE DECLINES : 905
Nifty Open Interest Changed Today
Nifty- 5000 CE(Oct)- +1206250(+53.73%)
Nifty- 5000 PE(Oct)- +34900(+0.56%)
Nifty- 5100 CE(Oct)- +1575200(+39.70%)
Nifty- 5100 PE(Oct)- +124550(+2.53%)
Nifty- 5200 CE(Oct)- +1670700(+24.48%)
Nifty- 5200 PE(Oct)- -42250(-2.54%)
Closing
Nifty- closed at 5,091.90(-47.25 Points & -0.92%)
Sensex- closed at 16,936.89(-148.45 Points & -0.87% )
CNX MIDCAP - closed at 7,062.95(-79.40 Points & -1.11%)
BSE SMALL CAP- closed at 6,866.27(-32.39 Points & -0.47%)
Nifty Spot-Levels & Trading Strategy for 21-10-2011
Nifty Spot-Levels
R3 5181
R2 5140
R1 5115
Avg 5074
S1 5049
S2 5008
S3 4983
Nifty Spot-Trading Strategy
H6 5157 Trgt 2
H5 5142 Trgt 1
H4 5127 Long breakout
H3 5109 Go Short
H2 5103
H1 5097
L 5084
L2 5078
L3 5072 Long
L4 5054 Short Breakout
L5 5039 Trgt 1
L6 5024 Trgt 2
R3 5181
R2 5140
R1 5115
Avg 5074
S1 5049
S2 5008
S3 4983
Nifty Spot-Trading Strategy
H6 5157 Trgt 2
H5 5142 Trgt 1
H4 5127 Long breakout
H3 5109 Go Short
H2 5103
H1 5097
L 5084
L2 5078
L3 5072 Long
L4 5054 Short Breakout
L5 5039 Trgt 1
L6 5024 Trgt 2
Nifty(Oct Fut)-Levels & Trading Strategy for 21-10-2011
Nifty(Oct Fut)-Levels
R3 5209
R2 5160
R1 5131
Avg 5082
S1 5053
S2 5004
S3 4975
Nifty(Oct Fut)-Trading Strategy
H6 5181 Trgt 2
H5 5162 Trgt 1
H4 5144 Long breakout
H3 5123 Go Short
H2 5116
H1 5109
L1 5094
L2 5087
L3 5080 Long
L4 5059 Short Breakout
L5 5041 Trgt 1
L6 5022 Trgt 2
R3 5209
R2 5160
R1 5131
Avg 5082
S1 5053
S2 5004
S3 4975
Nifty(Oct Fut)-Trading Strategy
H6 5181 Trgt 2
H5 5162 Trgt 1
H4 5144 Long breakout
H3 5123 Go Short
H2 5116
H1 5109
L1 5094
L2 5087
L3 5080 Long
L4 5059 Short Breakout
L5 5041 Trgt 1
L6 5022 Trgt 2
Bank Nifty(Oct Fut)-Levels & Trading Strategy for 21-10-2011
Bank Nifty(Oct Fut)-Levels
R3 10023
R2 9908
R1 9840
Avg 9725
S1 9657
S2 9542
S3 9474
Bank Nifty(Oct Fut)-Trading Strategy
H6 9958 Trgt 2
H5 9915 Trgt 1
H4 9872 Long breakout
H3 9822 Go Short
H2 9805
H1 9788
L1 9755
L2 9738
L3 9721 Long
L4 9671 Short Breakout
L5 9628 Trgt 1
L6 9585 Trgt 2
R3 10023
R2 9908
R1 9840
Avg 9725
S1 9657
S2 9542
S3 9474
Bank Nifty(Oct Fut)-Trading Strategy
H6 9958 Trgt 2
H5 9915 Trgt 1
H4 9872 Long breakout
H3 9822 Go Short
H2 9805
H1 9788
L1 9755
L2 9738
L3 9721 Long
L4 9671 Short Breakout
L5 9628 Trgt 1
L6 9585 Trgt 2
Pre-Closing Outlook(20-10-2011)
Support range of 5012-5035 was mentioned in both previous outlooks and Nifty bounced from 5033.95 after good consolidation between 5034-5050.
Indian markets are range bound between 5012-5155 and global cues led random moves within this range for the last 6 sessions therefore will be safer to get confirmation through sustaining beyond this range.
Indian markets are range bound between 5012-5155 and global cues led random moves within this range for the last 6 sessions therefore will be safer to get confirmation through sustaining beyond this range.
Mid-session Outlook(20-10-2011)
Markets are highly volatile on violent global cues and without much intraday trading positions therefore next moves confirmation will be only sustaining beyond any crucial level.
Intraday support was seen between 5012-5035 on 18-10-2011 and Nifty is trading at higher levels of this range for the last 2 hours. 10 days old pull back rally and interpretation of sustaining beyond this range will be as follows:-
1- Finally sustaining above 5035 will mean pull back rally correction completion and up moves for testing resistances between 5145-5220.
2- Finally sustaining below 5012 will mean pull back rally termination and beginning of fresh down moves towards lower levels of 51 sessions old trading range(4720-5229).
Post-open Outlook(20-10-2011)
Weakness clearly seen today and Indian markets are under performing global cues as well. 6 hours trading range(5108-5125) was mentioned in two previous topics which was broken out yesterday and broken down today on the back of strong/weaker global cues.
Global cues led high volatility nowadays and Nifty slipped below 5108 today. Next supports are between 5012-5035, as real weakness is clearly visible today therefore its testing is possible and on going rally termination confirmation will be after sustaining below 5012.
Pre-open Outlook(20-10-2011)
Nifty traded 6 hours trading within or near about 5108-5125 in last 2 days.This range was broken out and Nifty traded last one hour above 5125 yesterday. As up move was without force therefore doubts were expressed in both previous outlooks(Pre-Closing and Nifty-Micro Analysis) following line were told:-
1- confirmation is required tomorrow through sustaining above 5125 and crossing first resistance range of 5125-5155.
2- If Nifty fails to sustain above 5125 then break out and sustaining beyond 6 hours trading range(5108-5125) should be watched for next moves confirmations.
More than 40/50 points up/down opening nowadays on the back of extreme bullish/bearish Global cues. As global cues are weak therefore 40/50 points down opening will be seen today but sustaining below 5108 will be down moves confirmation therefore should be firstly watched today.
Nifty-Micro Analysis of Intra Day Chart For 20-10-2011
Nifty-Intra Day Chart(19-Oct-2011):-
Technical Patterns and Formations in today intraday charts
1- Consolidation Patterns between 5076-5085
2- Consolidation between 5095-5102
3- 3 Hours mixed patterns between 5108-5125
4- Last 1 hour up move without force between 5122-5148
5- Whole day trading between 5095-5148
Conclusions
Nifty traded last 3 hours between 5108-5125 with mixed patterns on 17-10-2011 and Nifty again traded 3 hours within same same range today. Firstly trading with mixed patterns today and after that up move in last 1 hour without force between 5122-5148 therefore more requirement of consolidation and up moves confirmation through sustaining above 5125 and minimum crossing first resistance range of 5125-5155 tomorrow or in the coming sessions.
Resistances at higher levels are as follows;-
1- Selling between 5135-5155(on 17-10-2011)
2- Old Resistance 5145-5220
Resistances at higher levels therefore follow up buying and consolidation is must for crossing above resistances and sustaining above last 50 sessions trading range highest(5229)
Firstly watch sustaining above 5125 and that will be first strong signal of blasting rally beginning above 5229. If Nifty fails to sustain above 5125 then break out and sustaining beyond 6 hours trading range(5108-5125) should be watched for next moves confirmations.
 |
| Just click on chart for its enlarged view |
1- Consolidation Patterns between 5076-5085
2- Consolidation between 5095-5102
3- 3 Hours mixed patterns between 5108-5125
4- Last 1 hour up move without force between 5122-5148
5- Whole day trading between 5095-5148
Conclusions
Nifty traded last 3 hours between 5108-5125 with mixed patterns on 17-10-2011 and Nifty again traded 3 hours within same same range today. Firstly trading with mixed patterns today and after that up move in last 1 hour without force between 5122-5148 therefore more requirement of consolidation and up moves confirmation through sustaining above 5125 and minimum crossing first resistance range of 5125-5155 tomorrow or in the coming sessions.
Resistances at higher levels are as follows;-
1- Selling between 5135-5155(on 17-10-2011)
2- Old Resistance 5145-5220
Resistances at higher levels therefore follow up buying and consolidation is must for crossing above resistances and sustaining above last 50 sessions trading range highest(5229)
Firstly watch sustaining above 5125 and that will be first strong signal of blasting rally beginning above 5229. If Nifty fails to sustain above 5125 then break out and sustaining beyond 6 hours trading range(5108-5125) should be watched for next moves confirmations.

FII & DII trading activity in Capital Market Segment on 19-Oct-2011
| ||||||||||||||||
| ||||||||||||||||
Indian Stock Markets Closing Reports(19-Oct-2011)
Main features of today trading are as follows
1- Long White Candle after gap up opening.
2- All the Indices closed in Green and most with good gains.
3- Closing at the top of on going rally.
Ratios
Nifty Put Call Ratio: 1.16
Nifty P/E Ratio(19-Oct-2011): 18.36
Advances & Declines
BSE ADVANCES : 1664
BSE DECLINES : 1151
NSE ADVANCES : 949
NSE DECLINES : 459
Nifty Open Interest Changed Today
Nifty- 5000 CE(Oct)- -1007750(-30.08)
Nifty- 5000 PE(Oct)- +521500(+8.91%)
Nifty- 5100 CE(Oct)- -448900(-8.84%)
Nifty- 5100 PE(Oct)- +2488050(+87.20%)
Nifty- 5200 CE(Oct)- +485400(+7.29%)
Nifty- 5200 PE(Oct)- +606350(+55.79%)
Closing
Nifty- closed at 5,138.05(+101.65 Points & +2.02%)
Sensex- closed at 17,085.34(+337.05 Points & +2.01% )
CNX MIDCAP - closed at 7,142.55(+94.70 Points & +1.34%)
BSE SMALL CAP- closed at 6,898.66(+44.28 Points & +0.65%)
Nifty Spot-Levels & Trading Strategy for 20-10-2011
Nifty Spot-Levels
R3 5239
R2 5193
R1 5166
Avg 5120
S1 5093
S2 5047
S3 5020
Nifty Spot-Trading Strategy
H6 5212 Trgt 2
H5 5196 Trgt 1
H4 5179 Long breakout
H3 5159 Go Short
H2 5152
H1 5145
L1 5132
L2 5125
L3 5118 Long
L4 5098 Short Breakout
L5 5081 Trgt 1
L6 5065 Trgt 2
R3 5239
R2 5193
R1 5166
Avg 5120
S1 5093
S2 5047
S3 5020
Nifty Spot-Trading Strategy
H6 5212 Trgt 2
H5 5196 Trgt 1
H4 5179 Long breakout
H3 5159 Go Short
H2 5152
H1 5145
L1 5132
L2 5125
L3 5118 Long
L4 5098 Short Breakout
L5 5081 Trgt 1
L6 5065 Trgt 2
Nifty(Oct Fut)-Levels & Trading Strategy for 20-10-2011
Nifty(Oct Fut)-Levels
R3 5267
R2 5212
R1 5180
Avg 5125
S1 5093
S2 5038
S3 5006
Nifty(Oct Fut)-Trading Strategy
H6 5237 Trgt 2
H5 5217 Trgt 1
H4 5196 Long breakout
H3 5172 Go Short
H2 5164
H1 5156
L1 5141
L2 5133
L3 5125 Long
L4 5101 Short Breakout
L5 5080 Trgt 1
L6 5060 Trgt 2
R3 5267
R2 5212
R1 5180
Avg 5125
S1 5093
S2 5038
S3 5006
Nifty(Oct Fut)-Trading Strategy
H6 5237 Trgt 2
H5 5217 Trgt 1
H4 5196 Long breakout
H3 5172 Go Short
H2 5164
H1 5156
L1 5141
L2 5133
L3 5125 Long
L4 5101 Short Breakout
L5 5080 Trgt 1
L6 5060 Trgt 2
Bank Nifty(Oct Fut)-Levels & Trading Strategy for 20-10-2011
Bank Nifty(Oct Fut)-Levels
R3 10180
R2 10028
R1 9942
Avg 9790
S1 9704
S2 9552
S3 9466
Bank Nifty(Oct Fut)-Trading Strategy
H6 10099 Trgt 2
H5 10043 Trgt 1
H4 9986 Long breakout
H3 9921 Go Short
H2 9899
H1 9877
L1 9834
L2 9812
L3 9790 Long
L4 9725 Short Breakout
L5 9668 Trgt 1
L6 9612 Trgt 2
R3 10180
R2 10028
R1 9942
Avg 9790
S1 9704
S2 9552
S3 9466
Bank Nifty(Oct Fut)-Trading Strategy
H6 10099 Trgt 2
H5 10043 Trgt 1
H4 9986 Long breakout
H3 9921 Go Short
H2 9899
H1 9877
L1 9834
L2 9812
L3 9790 Long
L4 9725 Short Breakout
L5 9668 Trgt 1
L6 9612 Trgt 2
Pre-Closing Outlook(1910-2011)
Nifty traded last 3 hours between 5108-5125 with mixed patterns on on 17-10-2011 and it was mentioned on same day. Nifty again traded within or near about same range for more than 3 hours and it was again mentioned in Mid-session Outlook today.
6 hours trading within or near about 5108-5125 and Nifty moved above 5125 and also trading above for the last half hour but lacking force therefore confirmation is required tomorrow through sustaining above 5125 and crossing first resistance range of 5125-5155.
Resistances at higher levels are as follows;-
1- Selling between 5135-5155(on 17-10-2011)
2- Old Resistance 5145-5220
Finally sustaining above 5125 will mean high possibility of blasting rally.
Mid-session Outlook(1910-2011)
Nifty traded 3 hours with mixed intraday patterns between 5108-5125 on 17-Oct-2011 and Nifty is again trading within or near about this range for the last 90 minutes. Selling and resistances above this range and minor supports also below this range. Sustaining beyond this range will be first strong indication next moves beginning therefore
Firstly watch sustaining beyond 5108-5125 for next moves confirmation.
Firstly watch sustaining beyond 5108-5125 for next moves confirmation.
Post-open Outlook(1910-2011)
Strong opening,trading near today highs but sentiment turned heated therefore buying should be done after some intraday correction.
Technical Analysis and Research For 19-10-2011
Post-open Outlook(1910-2011)
Nifty-EOD Chart(18-Oct-2011):-
Technical Patterns and Formations in EOD charts
1- 49 Sessions range bound market between 4720-5229
2- Gap of resistance 18-10-2011(5058-5085)
3- 3 Days range bound market within 5070-5155
Conclusions
Indian markets consolidated at lower levels yesterday and it was updated during trading hours yesterday in Pre-Closing Outlook and following lines were told:-
Although deep Red closing today but consolidation signals also in today intraday patterns therefore view should be bearish after sustaining below 5012.
Following lines were told yesterday in Nifty-Micro Analysis of Intra Day Chart For 19-10-2011
As whole day consolidation patterns today therefore positive market as well as up moves continuation expected tomorrow.
Gap up opening today and Nifty is trading within mentioned 3 Days range bound market of 5070-5155 in which mixed patterns were seen between 13th oct to 17th oct 2011.
Follow up buying,up moves and positive market expected today.
Nifty-EOD Chart(18-Oct-2011):-
 |
| Just click on chart for its enlarged view |
1- 49 Sessions range bound market between 4720-5229
2- Gap of resistance 18-10-2011(5058-5085)
3- 3 Days range bound market within 5070-5155
Conclusions
Indian markets consolidated at lower levels yesterday and it was updated during trading hours yesterday in Pre-Closing Outlook and following lines were told:-
Although deep Red closing today but consolidation signals also in today intraday patterns therefore view should be bearish after sustaining below 5012.
Following lines were told yesterday in Nifty-Micro Analysis of Intra Day Chart For 19-10-2011
As whole day consolidation patterns today therefore positive market as well as up moves continuation expected tomorrow.
Gap up opening today and Nifty is trading within mentioned 3 Days range bound market of 5070-5155 in which mixed patterns were seen between 13th oct to 17th oct 2011.
Follow up buying,up moves and positive market expected today.
Nifty-Micro Analysis of Intra Day Chart For 19-10-2011
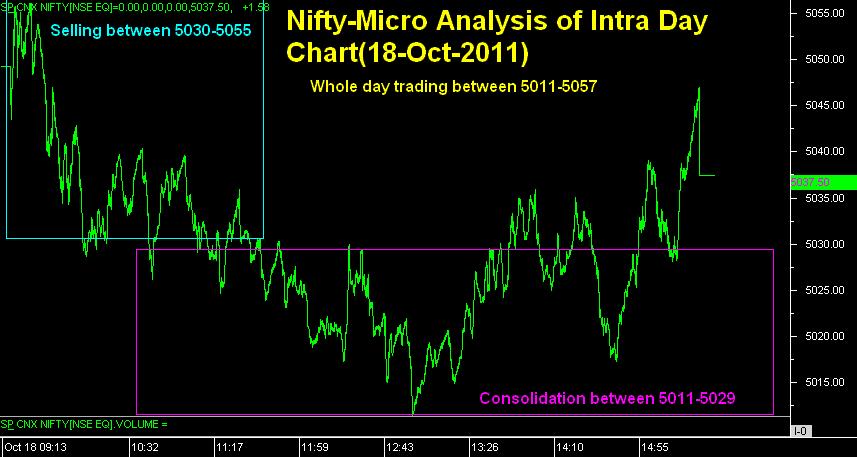
Nifty-Intra Day Chart(18-Oct-2011):-
Technical Patterns and Formations in today intraday charts
1- Selling between 5030-5057
2- Consolidation between 5011-5029
3- Whole day trading between 5011-5057
Conclusions
Gap down opening and whole day deep Red today trading was due to crashing Global markets cues therefore finally sustaining point of market will decide next trend. Although selling seen at higher levels but support also seen at lower levels today.
8 Days rally from the bottom of 49 sessions range lowest(4728) with 3 days range bound market with mixed intraday patterns within 5070-5155. As lower levels support today and and whole day intraday consolidation patterns also seen therefore sustaining above today high(5057) will be confirmation of 8 days corrction and its completion also today.
Today down moves were not the result of higher levels pure selling but depressing global cues therefore follow up buying in the coming sessions will mean up moves to test 8 days rally highest.
As whole day consolidation patterns today therefore positive market as well as up moves continuation expected tomorrow.
 |
| Just click on chart for its enlarged view |
1- Selling between 5030-5057
2- Consolidation between 5011-5029
3- Whole day trading between 5011-5057
Conclusions
Gap down opening and whole day deep Red today trading was due to crashing Global markets cues therefore finally sustaining point of market will decide next trend. Although selling seen at higher levels but support also seen at lower levels today.
8 Days rally from the bottom of 49 sessions range lowest(4728) with 3 days range bound market with mixed intraday patterns within 5070-5155. As lower levels support today and and whole day intraday consolidation patterns also seen therefore sustaining above today high(5057) will be confirmation of 8 days corrction and its completion also today.
Today down moves were not the result of higher levels pure selling but depressing global cues therefore follow up buying in the coming sessions will mean up moves to test 8 days rally highest.
As whole day consolidation patterns today therefore positive market as well as up moves continuation expected tomorrow.

FII & DII trading activity in Capital Market Segment on 18-Oct-2011
| ||||||||||||||||
| ||||||||||||||||
Indian Stock Markets Closing Reports(18-Oct-2011)
Main features of today trading are as follows
1- Red closing.
2- Black Candle.
3- All the Indiced in Red.
4- Intraday support seen at lower levels today.
Ratios
Nifty Put Call Ratio: 1.15
Nifty P/E Ratio(18-Oct-2011): 18.00
Advances & Declines
BSE ADVANCES : 896
BSE DECLINES : 1891
NSE ADVANCES : 344
NSE DECLINES : 1077
Nifty Open Interest Changed Today
Nifty- 5000 CE(Oct)- +703750(+25.53%)
Nifty- 5000 PE(Oct)- -13200(-0.21%)
Nifty- 5100 CE(Oct)- +1100(+0.02%)
Nifty- 5100 PE(Oct)- -1185600(-29.40%)
Closing
Nifty- closed at 5,037.50(-80.75 Points & -1.58%)
Sensex- closed at 16,748.29(-276.80 Points & -1.63% )
CNX MIDCAP - closed at 7,047.65(-91.90 Points & -1.29%)
BSE SMALL CAP- closed at 6,854.38(-68.59 Points & -0.99%)
Nifty Spot-Levels & Trading Strategy for 19-10-2011
Nifty Spot-Levels
R3 5105
R2 5081
R1 5059
Avg 5035
S1 5013
S2 4989
S3 4967
Nifty Spot-Trading Strategy
H6 5083 Trgt 2
H5 5072 Trgt 1
H4 5062 Long breakout
H3 5049 Go Short
H2 5045
H1 5041
L1 5032
L2 5028
L3 5024 Long
L4 5011 Short Breakout
L5 5001 Trgt 1
L6 4990 Trgt 2
R3 5105
R2 5081
R1 5059
Avg 5035
S1 5013
S2 4989
S3 4967
Nifty Spot-Trading Strategy
H6 5083 Trgt 2
H5 5072 Trgt 1
H4 5062 Long breakout
H3 5049 Go Short
H2 5045
H1 5041
L1 5032
L2 5028
L3 5024 Long
L4 5011 Short Breakout
L5 5001 Trgt 1
L6 4990 Trgt 2
Nifty(Oct Fut)-Levels & Trading Strategy for 19-10-2011
Nifty(Oct Fut)-Levels
R3 5117
R2 5090
R1 5067
Avg 5040
S1 5017
S2 4990
S3 4967
Nifty(Oct Fut)-Trading Strategy
H6 5094 Trgt 2
H5 5082 Trgt 1
H4 5071 Long breakout
H3 5057 Go Short
H2 5053
H1 5048
L1 5039
L2 5034
L3 5030 Long
L4 5016 Short Breakout
L5 5005 Trgt 1
L6 4993 Trgt 2
R3 5117
R2 5090
R1 5067
Avg 5040
S1 5017
S2 4990
S3 4967
Nifty(Oct Fut)-Trading Strategy
H6 5094 Trgt 2
H5 5082 Trgt 1
H4 5071 Long breakout
H3 5057 Go Short
H2 5053
H1 5048
L1 5039
L2 5034
L3 5030 Long
L4 5016 Short Breakout
L5 5005 Trgt 1
L6 4993 Trgt 2
Bank Nifty(Oct Fut)-Levels & Trading Strategy for 19-10-2011
Bank Nifty(Oct Fut)-Levels
R3 9886
R2 9785
R1 9682
Avg 9581
S1 9478
S2 9377
S3 9274
Bank Nifty(Oct Fut)-Trading Strategy
H6 9785 Trgt 2
H5 9738 Trgt 1
H4 9691 Long breakout
H3 9635 Go Short
H2 9616
H1 9597
L1 9560
L2 9541
L3 9522 Long
L4 9466 Short Breakout
L5 9419 Trgt 1
L6 9372 Trgt 2
R3 9886
R2 9785
R1 9682
Avg 9581
S1 9478
S2 9377
S3 9274
Bank Nifty(Oct Fut)-Trading Strategy
H6 9785 Trgt 2
H5 9738 Trgt 1
H4 9691 Long breakout
H3 9635 Go Short
H2 9616
H1 9597
L1 9560
L2 9541
L3 9522 Long
L4 9466 Short Breakout
L5 9419 Trgt 1
L6 9372 Trgt 2
Pre-Closing Outlook(18-10-2011)
Crashed global cues led down moves today with intraday selling patterns between 5030-5045 and supports at lower levels also. Intraday positions are not one sided today and Nifty will again trade near about today trading range(5012-5045) therefore its break out will be next moves confirmation.
Although deep Red closing today but consolidation signals also in today intraday patterns therefore view should be bearish after sustaining below 5012.
Pre-open Outlook(18-10-2011)
All the Asian markets are showing crashing character after US markets more than 1.5% down closing yesterday and Indian markets will also react Global weakness through gap down opening today. Sustaining below 5080 will mean breaking down of last 3 days range and confirmation of 7 days old pull back rally termination as well as beginning of down moves within 48 sessions range bound markets(4720-5229) and next support of 4960-4980 may be tested.
Blog may not be updated in next 2/3 hours.
Blog may not be updated in next 2/3 hours.
Technical Analysis,Researches & Market Outlook(18-10-2011)
Nifty-Intra Day Chart(17-Oct-2011):-
Technical Patterns and Formations in today intraday charts
1- Selling between 5135-5155
2- Selling between 5121-5133
3- Last 3 hours mixed patterns between 5108-5125
4- Whole day trading between 5086-5155
Nifty-Intra Day Chart(Oct 13 to Oct 17,2011):-
Technical Patterns and Formations in last 3 sessions intraday charts
1- Last 3 days trading between 5070-5155
2- Buying,Selling and Mixed intraday patterns in last 3 days.
Conclusions
Lower levels buying,higher levels selling and also mixed intraday patterns in last 3 days. When all the global markets were blasting then we did not posted bullish views because strong resistance at higher levels between 5145-5220.
US markets are more than 1.75% down at this moment then also we are not bearish because pure selling patterns not seen in last 3 days and it has also been shown in above charts.
Expected that sentiment will be depressed today morning and weak opening will be seen in Indian markets also. Nifty traded between 5080-5155 in last 3 days and sustaining below 5080 is must for the confirmation of 7 days old pull back rally termination.
Violent volatility in Global markets nowadays. US markets were more than 1.5% up last Friday and today down in same pct terms. Indian markets did not responded strong Global cues yesterday and closed with minor loss. Let Indian markets react Global weakness then Indian markets reaction will be understood and will be updated in the Blog as lesser strength was told within first 2 minutes yesterday.
Only watch that Nifty is sustaining below 5080 or not after weak opening today. Something cooked between 5080-5155 in last 3 days and sustaining beyond this range will be next strong moves confirmation therefore will be watched firstly today.
 |
| Just click on chart for its enlarged view |
1- Selling between 5135-5155
2- Selling between 5121-5133
3- Last 3 hours mixed patterns between 5108-5125
4- Whole day trading between 5086-5155
Nifty-Intra Day Chart(Oct 13 to Oct 17,2011):-
 |
| Just click on chart for its enlarged view |
1- Last 3 days trading between 5070-5155
2- Buying,Selling and Mixed intraday patterns in last 3 days.
Conclusions
Lower levels buying,higher levels selling and also mixed intraday patterns in last 3 days. When all the global markets were blasting then we did not posted bullish views because strong resistance at higher levels between 5145-5220.
US markets are more than 1.75% down at this moment then also we are not bearish because pure selling patterns not seen in last 3 days and it has also been shown in above charts.
Expected that sentiment will be depressed today morning and weak opening will be seen in Indian markets also. Nifty traded between 5080-5155 in last 3 days and sustaining below 5080 is must for the confirmation of 7 days old pull back rally termination.
Violent volatility in Global markets nowadays. US markets were more than 1.5% up last Friday and today down in same pct terms. Indian markets did not responded strong Global cues yesterday and closed with minor loss. Let Indian markets react Global weakness then Indian markets reaction will be understood and will be updated in the Blog as lesser strength was told within first 2 minutes yesterday.
Only watch that Nifty is sustaining below 5080 or not after weak opening today. Something cooked between 5080-5155 in last 3 days and sustaining beyond this range will be next strong moves confirmation therefore will be watched firstly today.

FII & DII trading activity in Capital Market Segment on 17-Oct-2011
| ||||||||||||||||
| ||||||||||||||||
Indian Stock Markets Closing Reports(17-Oct-2011)
Main features of today trading are as follows
1- Benchmark Indices closed in Red.
2- Black Candle.
3- No clear trend and most Indices closed with minor gains/loss
Ratios
Nifty Put Call Ratio: 1.12
Nifty P/E Ratio(17-Oct-2011): 18.50
Advances & Declines
BSE ADVANCES : 1314
BSE DECLINES : 1453
NSE ADVANCES : 669
NSE DECLINES : 761
Nifty Open Interest Changed Today
Nifty- 5000 CE(Oct)- -36500(-1.29%)
Nifty- 5000 PE(Oct)- -28300(-0.43%)
Nifty- 5100 CE(Oct)- +1269500(+30.21%)
Nifty- 5100 PE(Oct)- +121650(+2.89%)
Nifty- 5200 CE(Oct)- +1069150(+16.90%)
Nifty- 5200 PE(Oct)- +74450(+5.25%)
Closing
Nifty- closed at 5,118.25(-14.05 Points & -0.27%)
Sensex- closed at 17,025.09(-57.60 Points & -0.34% )
CNX MIDCAP - closed at 7,139.55(+3.60 Points & +0.05%)
BSE SMALL CAP- closed at 6,922.97(+15.01 Points & +0.22%)
Nifty Spot-Levels & Trading Strategy for 18-10-2011
Nifty Spot-Levels
R3 5233
R2 5196
R1 5157
Avg 5120
S1 5081
S2 5044
S3 5005
Nifty Spot-Trading Strategy
H6 5194 Trgt 2
H5 5177 Trgt 1
H4 5159 Long breakout
H3 5138 Go Short
H2 5131
H1 5124
L1 5111
L2 5104
L3 5097 Long
L4 5076 Short Breakout
L5 5058 Trgt 1
L6 5041 Trgt 2
R3 5233
R2 5196
R1 5157
Avg 5120
S1 5081
S2 5044
S3 5005
Nifty Spot-Trading Strategy
H6 5194 Trgt 2
H5 5177 Trgt 1
H4 5159 Long breakout
H3 5138 Go Short
H2 5131
H1 5124
L1 5111
L2 5104
L3 5097 Long
L4 5076 Short Breakout
L5 5058 Trgt 1
L6 5041 Trgt 2
Nifty(Oct Fut)-Levels & Trading Strategy for 18-10-2011
Nifty(Oct Fut)-Levels
R3 5238
R2 5200
R1 5157
Avg 5119
S1 5076
S2 5038
S3 4995
Nifty(Oct Fut)-Trading Strategy
H6 5196 Trgt 2
H5 5178 Trgt 1
H4 5159 Long breakout
H3 5137 Go Short
H2 5129
H1 5122
L1 5107
L2 5100
L3 5092 Long
L4 5070 Short Breakout
L5 5051 Trgt 1
L6 5033 Trgt 2
R3 5238
R2 5200
R1 5157
Avg 5119
S1 5076
S2 5038
S3 4995
Nifty(Oct Fut)-Trading Strategy
H6 5196 Trgt 2
H5 5178 Trgt 1
H4 5159 Long breakout
H3 5137 Go Short
H2 5129
H1 5122
L1 5107
L2 5100
L3 5092 Long
L4 5070 Short Breakout
L5 5051 Trgt 1
L6 5033 Trgt 2
Bank Nifty(Oct Fut)-Levels & Trading Strategy for 18-10-2011
Bank Nifty(Oct Fut)-Levels
R3 9906
R2 9847
R1 9774
Avg 9715
S1 9642
S2 9583
S3 9510
Bank Nifty(Oct Fut)-Trading Strategy
H6 9834 Trgt 2
H5 9804 Trgt 1
H4 9774 Long breakout
H3 9738 Go Short
H2 9726
H1 9714
L1 9689
L2 9677
L3 9665 Long
L4 9629 Short Breakout
L5 9599 Trgt 1
L6 9569 Trgt 2
R3 9906
R2 9847
R1 9774
Avg 9715
S1 9642
S2 9583
S3 9510
Bank Nifty(Oct Fut)-Trading Strategy
H6 9834 Trgt 2
H5 9804 Trgt 1
H4 9774 Long breakout
H3 9738 Go Short
H2 9726
H1 9714
L1 9689
L2 9677
L3 9665 Long
L4 9629 Short Breakout
L5 9599 Trgt 1
L6 9569 Trgt 2
Pre-Closing Outlook(17-10-2011)
Following lines were told in Pre-Closing Outlook(14-10-2011)
last 90 minutes intraday patterns are also showing mixed formations therefore sustaining beyond 5112-5140 will be firstly watched for confirmation on next Monday.
Today intraday charts are showing that Nifty traded most of the time between last Friday range(5112-5140) and again traded with mixed intraday patterns in last 3 hours between 5108-5125.
It is clear that next strong moves have been cooked between 5108-5140 in last 2 days and this range break out will give following decisive moves:-
1- Termination of 6 days old pull back rally below 5108/5085 or
2- Continuation of rally above 5125/5160 but strong resistances at higher levels therefore complete consolidation is required.
Mixed intraday patterns therefore will be safer to get confirmation through break out of above mentioned ranges for next strong trend.
Mid-session Outlook(17-10-2011)
Although gap up opening but was not strong therefore it was updated within first 2 minutes after opening in Post-open Outlook today and Nifty slipped also more than 30 points after our above message.
Minor intraday selling seen at higher levels today and until Nifty will not cross 5155 till then next up move will not be considered but market require complete formations for any side decisive moves and will prepare in the coming hpurs for that.
Intraday selling after lesser strength opening is weakness signal and sustaining below 5112 will be down moves confirmation. Indian markets are trading within mentioned range(5112-5172) since opening today and its break out will be next moves confirmations.
Bullish'W' Pattern in last 47 sessions
Technical Analysis and Research For 17-10-2011
Nifty-EOD Chart(14-Oct-2011):-
 |
| Just click on chart for its enlarged view |
1- Bullish'W' Pattern in last 47 sessions range bound market
2- Falling Trend line break out last Friday
Conclusions
Correction begun on Deepawali-2010 from 6339 and range bound market within 4720-5229 in last 47 sessions. Many times Market take pause,become range bound and prepare for next moves. Indian markets remained range boud 5 months after 2008 crash and then strong rally begun in March 2009 and same possibility can not be ruled out this time also.
Bullish'W' Pattern in last 47 sessions range bound market,falling trend line break out last Friday and gap up opening will be seen today after strong global cues today morning. Nifty will trade between strong resistance range(5145-5220) today and follow up consolidation is must in the coming sessions for crossing and sustaining above 5229.
Expected that Nifty will firstly trade and prepare for next moves within 5112-5172. As heated sentiment therefore profit booking possibility will also be kept in mind. Mentioned range will be watched first and break out of this range will be result of next moves today preparation as well as confirmation will be sustaining beyond 5112-5220.
Technical Analysis & Market Outlook(17-10-2011)
Nifty-Intra Day Chart(14-Oct-2011):-
Technical Patterns and Formations in today intraday charts
1- Consolidation between 5073-5100
2- Last 90 minutes mixed patterns 5112-5140
3- Whole day trading between 5073-5141
Conclusions
Good lower levels consolidations last friday but next strong resistances are between 5145-5220 and mixed trading patterns also seen last Friday between 5073-5141 therefore Indian markets require complete consolidation firstly to cross 5141 and then finally to sustain above 5229.
Expected that sentiment will be strong Monday morning due to following reasons;-
1- Good RIL results last Saturday.
2- US market strong rally last Friday.
3- Indian markets benchmark Indices closing more than 1% up last Friday.
Coming couple of sessions will be crucial for deciding the net conclusion of last 47 sessions range bound market(4720-5229). It is confirm that market require complete consolidation to clear next strong resistances(5145-5220) therefore Follow up buying/selling intraday patterns will be firstly watched for first indication of next big moves and will be updated in the Mid-session Outlooks in the Blog as being done for the last one year.
All the possibilities are very much open at this moment and Indian markets are not prepared for any side trending market therefore no guessing and let market prepare for a decisive market after(or without) break out then final conclusions will be drawn accrding to markets positions and intraday charts formations.
 |
| Just click on chart for its enlarged view |
1- Consolidation between 5073-5100
2- Last 90 minutes mixed patterns 5112-5140
3- Whole day trading between 5073-5141
Conclusions
Good lower levels consolidations last friday but next strong resistances are between 5145-5220 and mixed trading patterns also seen last Friday between 5073-5141 therefore Indian markets require complete consolidation firstly to cross 5141 and then finally to sustain above 5229.
Expected that sentiment will be strong Monday morning due to following reasons;-
1- Good RIL results last Saturday.
2- US market strong rally last Friday.
3- Indian markets benchmark Indices closing more than 1% up last Friday.
Coming couple of sessions will be crucial for deciding the net conclusion of last 47 sessions range bound market(4720-5229). It is confirm that market require complete consolidation to clear next strong resistances(5145-5220) therefore Follow up buying/selling intraday patterns will be firstly watched for first indication of next big moves and will be updated in the Mid-session Outlooks in the Blog as being done for the last one year.
All the possibilities are very much open at this moment and Indian markets are not prepared for any side trending market therefore no guessing and let market prepare for a decisive market after(or without) break out then final conclusions will be drawn accrding to markets positions and intraday charts formations.
Indian Stock Markets Closing Reports(14-Oct-2011)
Main features of today trading are as follows
1- Long White candle.
2- All the Indices closed in Green except metals.
3- Whole day up moves and trading between last resistance range of last 47 trading sessions.
Ratios
Nifty Put Call Ratio: 1.17
Nifty P/E Ratio(14-Oct-2011): 18.55
Advances & Declines
BSE ADVANCES : 1419
BSE DECLINES : 1361
NSE ADVANCES : 735
NSE DECLINES : 687
Nifty Open Interest Changed Today
Nifty- 5000 CE(Oct)- -416850(-12.74%)
Nifty- 5000 PE(Oct)- +1284150(+23.00%)
Nifty- 5100 CE(Oct)- -626550(-12.59%)
Nifty- 5100 PE(Oct)- +1507700(+53.94%)
Nifty- 5200 CE(Oct)- +71100(+1.11%)
Nifty- 5200 PE(Oct)- +478200(+48.90%)
Closing
Nifty- closed at 5,131.35(+54.45 Points & +1.07%)
Sensex- closed at 17,082.69(+198.77 Points & +1.18% )
CNX MIDCAP - closed at 7,133.45(+29.55 Points & +0.42%)
BSE SMALL CAP- closed at 6,907.96(+21.69 Points & +0.31%)
Nifty Spot-Levels & Trading Strategy for 17-10-2011
Nifty Spot-Levels
R3 5247
R2 5194
R1 5162
Avg 5109
S1 5077
S2 5024
S3 4992
Nifty Spot-Trading Strategy
H6 5217 Trgt 2
H5 5197 Trgt 1
H4 5177 Long breakout
H3 5154 Go Short
H2 5146
H1 5138
L1 5123
L2 5115
L3 5107 Long
L4 5084 Short Breakout
L5 5064 Trgt 1
L6 5044 Trgt 2
R3 5247
R2 5194
R1 5162
Avg 5109
S1 5077
S2 5024
S3 4992
Nifty Spot-Trading Strategy
H6 5217 Trgt 2
H5 5197 Trgt 1
H4 5177 Long breakout
H3 5154 Go Short
H2 5146
H1 5138
L1 5123
L2 5115
L3 5107 Long
L4 5084 Short Breakout
L5 5064 Trgt 1
L6 5044 Trgt 2
Nifty(Oct Fut)-Levels & Trading Strategy for 17-10-2011
Nifty(Oct Fut)-Levels
R3 5275
R2 5214
R1 5178
Avg 5117
S1 5081
S2 5020
S3 4984
Nifty(Oct Fut)-Trading Strategy
H6 5241 Trgt 2
H5 5219 Trgt 1
H4 5196 Long breakout
H3 5169 Go Short
H2 5160
H1 5151
L1 5134
L2 5125
L3 5116 Long
L4 5089 Short Breakout
L5 5066 Trgt 1
L6 5044 Trgt 2
R3 5275
R2 5214
R1 5178
Avg 5117
S1 5081
S2 5020
S3 4984
Nifty(Oct Fut)-Trading Strategy
H6 5241 Trgt 2
H5 5219 Trgt 1
H4 5196 Long breakout
H3 5169 Go Short
H2 5160
H1 5151
L1 5134
L2 5125
L3 5116 Long
L4 5089 Short Breakout
L5 5066 Trgt 1
L6 5044 Trgt 2
Bank Nifty(Oct Fut)-Levels & Trading Strategy for 17-10-2011
Bank Nifty(Oct Fut)-Levels
R3 9967
R2 9833
R1 9753
Avg 9619
S1 9539
S2 9405
S3 9325
Bank Nifty(Oct Fut)-Trading Strategy
H6 9892 Trgt 2
H5 9841 Trgt 1
H4 9791 Long breakout
H3 9732 Go Short
H2 9713
H1 9693
L1 9654
L2 9634
L3 9615 Long
L4 9556 Short Breakout
L5 9506 Trgt 1
L6 9455 Trgt 2
R3 9967
R2 9833
R1 9753
Avg 9619
S1 9539
S2 9405
S3 9325
Bank Nifty(Oct Fut)-Trading Strategy
H6 9892 Trgt 2
H5 9841 Trgt 1
H4 9791 Long breakout
H3 9732 Go Short
H2 9713
H1 9693
L1 9654
L2 9634
L3 9615 Long
L4 9556 Short Breakout
L5 9506 Trgt 1
L6 9455 Trgt 2
Nifty Spot-Weekly Levels & Trading Strategy(Oct 17 to Oct 21,2011)
Nifty Spot-Weekly Levels
R3 5479
R2 5310
R1 5220
Avg 5051
S1 4961
S2 4792
S3 4702
Nifty Spot-Weekly Trading Strategy
H6 5403 Trgt 2
H5 5338 Trgt 1
H4 5273 Long breakout
H3 5202 Go Short
H2 5178
H1 5154
L1 5107
L2 5083
L3 5059 Long
L4 4988 Short Breakout
L5 4923 Trgt 1
L6 4858 Trgt 2
R3 5479
R2 5310
R1 5220
Avg 5051
S1 4961
S2 4792
S3 4702
Nifty Spot-Weekly Trading Strategy
H6 5403 Trgt 2
H5 5338 Trgt 1
H4 5273 Long breakout
H3 5202 Go Short
H2 5178
H1 5154
L1 5107
L2 5083
L3 5059 Long
L4 4988 Short Breakout
L5 4923 Trgt 1
L6 4858 Trgt 2
Bank Nifty Spot-Weekly Levels & Trading Strategy(Oct 17 to Oct 21,2011)
Bank Nifty Spot-Weekly Levels
R3 10616
R2 10154
R1 9907
Avg 9445
S1 9198
S2 8736
S3 8489
Bank Nifty Spot-Weekly Trading Strategy
H6 10422 Trgt 2
H5 10236 Trgt 1
H4 10049 Long breakout
H3 9854 Go Short
H2 9789
H1 9724
L1 9595
L2 9530
L3 9465 Long
L4 9270 Short Breakout
L5 9083 Trgt 1
L6 8897 Trgt 2
R3 10616
R2 10154
R1 9907
Avg 9445
S1 9198
S2 8736
S3 8489
Bank Nifty Spot-Weekly Trading Strategy
H6 10422 Trgt 2
H5 10236 Trgt 1
H4 10049 Long breakout
H3 9854 Go Short
H2 9789
H1 9724
L1 9595
L2 9530
L3 9465 Long
L4 9270 Short Breakout
L5 9083 Trgt 1
L6 8897 Trgt 2
Subscribe to:
Posts (Atom)