Crucial levels will firstly indicate and after that confirm deeper correction
Nifty & Bank Nifty Weekly Outlook
(Jul 27 to Jul 31,2020)
Nifty-EOD Chart Analysis
(Wave-B Trendline & Stochastics)
Nifty-EOD Chart (24-Jul-2020):-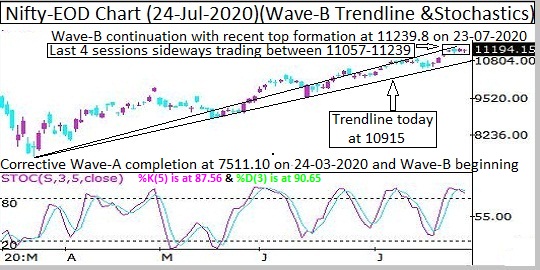
Technical Patterns and Formations in EOD charts
1- Corrective Wave-A completion at 7511.10 on 24-03-2020 and Wave-B beginning
2- Wave-B continuation with recent top formation at 11239.8 on 23-07-2020
3- Stochastic-%K(5) is at 87.56 & %D(3) is at 90.65
4- Last 4 sessions sideways trading between 11057-11239
5- Trend line today at 10915
Conclusions from EOD chart analysis
(Wave-B Trend line & Stochastics)
Wave-B continuation with recent top formation at 11239.8 and no confirmation of its completion yet.
As %K(5) of Short Term Indicator Stochastics has intersected downward %D(3) in overbought zone therefore emergence of Short Term correction expectations in the coming week and following levels should be watched for the life and size of expected correction:-
1- Last 4 sessions sideways trading between 11057-11239 and moving below 11057 will be first indication of correction beginning.
2- Trend line of Wave-B is today at 10915 and its valid break down will be correction confirmation.
3- 200-Day SMA is today at 10862 and sustaining below it will mean strong possibility of Wave-C beginning after Wave-B completion.
Nifty
Last 4 Sessions intraday charts analysis
Nifty-Intra Day Chart (Jul 21 to Jul 24,2020):-
Technical Patterns formation in last 4 Sessions intraday charts
1- Selling(Resistances) in last 4 sessions are between:-
A- 11091-11146
B- 11057-11105
2- Consolidation(Supports) in last 4 sessions are sessions:-
A- 11157-11178
B- 11180-11239
3- 4 Sessions actual trading between 11057-11239
Conclusions from 4 Sessions intra day chart analysis
As both lower levels supports and higher levels selling in the last 4 sessions therefore Bank Nifty will firstly trade and prepare for next decisive moves within last 4 Sessions trading range(11057-11239) in coming week,finally sustaining it beyond will confirm next big moves which should be watched in next week.
Nifty-Intra Day Chart Analysi
(24-Jul-2020)
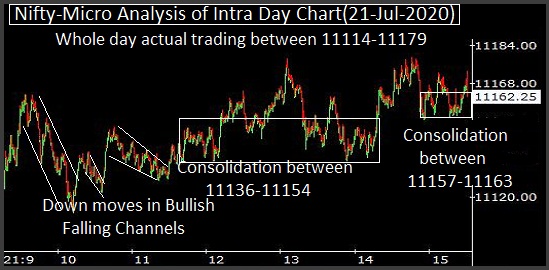
Nifty-Intra Day Chart (24-Jul-2020):-
Technical Patterns formation in today intraday charts
1- Consolidation between 11091-11146(Immediate Supports)
2- Up moves in Bearish Rising Channel
3- Sideways trading between 11177-11208
4- Whole day actual trading between 11091-11225
Conclusions from intra day chart analysis
As firstly lower levels consolidation therefore up moves were seen which were in Bearish Rising Channel hence some selling was also seen at higher levels and sideways trading developed between 11177-11208 in last hour.
Both consolidation and selling was seen last Friday between 11091-11225 and expected that Nifty will firstly trade and prepare for next decisive moves within this range in the beginning of next week but expected that finally Nifty will slip below 11091 after fresh selling in next week.
Bank Nifty-EOD Chart Analysis
(Wave-B Trend line & Stochastics)
Bank Nifty-EOD Chart (24-Jul-2020):-
Technical Patterns and Formations in EOD charts
1- Corrective Wave-A completion at 16116..3 on 24-03-2020 and Wave-B beginning
2- Wave-B continuation with recent top formation at 23211.3 on 22-07-2020
3- Trendline today at 21964
4- Stochastic-%K(5) is at 74.93 & %D(3) is at 84.86
5- Last 4 sessions sideways trading between 22418-23211
Conclusions from EOD chart analysis
(Wave-B Trend line & Stochastics)
Wave-B continuation with recent top formation at 23211.3 and no confirmation of its completion yet.
As %K(5) of Short Term Indicator Stochastics has intersected downward %D(3) in overbought zone therefore emergence of Short Term correction expectations in the coming week and following levels should be watched for the life and size of expected correction:-
1- Last 4 sessions sideways trading between 22418-23211 and moving below 22418 will be first indication of correction beginning.
2- Trend line of Wave-B is today at 21964 and its valid break down will be correction confirmation.
3- 55-Day SMA is today at 20706 and sustaining below it will mean strong possibility of Wave-C beginning after Wave-B completion.
Bank Nifty
Last 4 Sessions intraday charts analysis
Bank Nifty-Intra Day Chart (Jul 21 to Jul 24,2020):-
Technical Patterns formation in last 4 Sessions intraday charts
1- Selling(Resistances) in last 4 sessions are between:-
A- 22628-22774
B- 22775-23211
2- Consolidation(Supports) in last 4 sessions are sessions:-
A- 22418-22565
B- 22630-22709
3- 4 Sessions actual trading between 22418-23211
Conclusions from 4 Sessions intra day chart analysis
As both lower levels supports and higher levels selling in the last 4 sessions therefore Bank Nifty will firstly trade and prepare for next decisive moves within last 4 Sessions trading range(22418-23211) in coming week,finally sustaining it beyond will confirm next big moves which should be watched in next week.
Bank Nifty
Intra Day Chart Analysis(24-Jul-2020)
Bank Nifty-Intra Day Chart (24-Jul-2020):-
Technical Patterns formation in today intraday charts
1- Selling between 22628-22774(Immediate Resistances)
2- Down moves
3- Consolidation between 22417-22565(Immediate Supports)
4- Up moves in Bearish Rising Channel
5- Sideways trading between 22610-22704
6- Whole day actual trading between 22417-22854
Conclusions from intra day chart analysis
As firstly selling after much weaker opening therefore more down moves were seen but lower levels some consolidation hence some up moves after 01:30 PM. Up moves in Bearish Rising Channel and Sideways trading in last hour hence good selling will be understood last Friday.
Some consolidation was also seen at lower levels therefore expected that Nifty will firstly trade and prepare for next decisive moves between 22417-22774 in the beginning of next week but expected that finally Nifty will slip below 11091 after fresh selling in next week.
Conclusions
(After Putting All Studies Together)
Although Wave-B continuation with recent top formation at 11239.8 & 23211.3 and no confirmation of its completion yet but now this rally is very much mature for a deeper correction and Short Term indicators have also turned overbought therefore once sustaining below above mentioned 4 sessions lowest(11057 & 22418) will mean strong indications of that deeper correction beginning.
All the crucial levels for next moves beginning of Nifty and Bank Nifty has been updated above in EOD Charts analysis which should be watched in the coming week/weeks for that deeper correction beginning indications/confirmations.