Last 43 sessions trading range
break out/down will generate
next big moves
Nifty & Bank Nifty Weekly Outlook
(Aug 02 to Aug 30,2021)
Nifty-EOD Chart Analysis
(Waves structure)
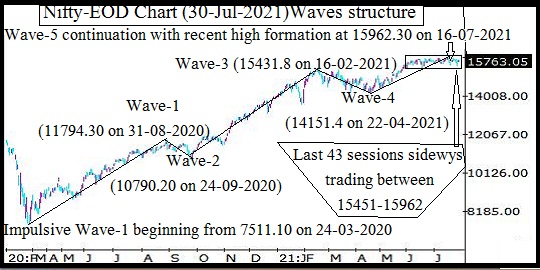
Nifty-EOD Chart (30-Jul-2021):-
Technical Patterns and Formations in EOD charts
1- Corrective Wave-C completion and Impulsive Wave-1 beginning from 7511.10 on 24-03-2020
2- Impulsive Wave-1 completion at 11794.30 on 31-08-2020
3- Corrective Wave-2 completion at 10790.20 on 24-09-2020
4- Impulsive Wave-3 completion after new life time top formation at 15431.8 on 16-02-2021
5- Corrective Wave-4 completion at 14151.4 on 22-04-2021
6- Impulsive Wave-5 continuation with recent high and new life time top formation at 15962.30 on 16-07-2021.
7- Last 43 sessions sideways trading between 15451-15962 from 01-06-2021 to 30-07-2021
Conclusions from EOD chart
analysis(Waves structure)
Impulsive Wave-5 continuation with recent high and new life time top formation at 15962.30 on 16-07-2021 and no confirmation of its completion yet.
As last 43 sessions sideways trading between 15451-15962 and finally sustaining beyond this range will form next big moves therefore should be firstly watched for its confirmations in the coming week/weeks.
Nifty-EOD Chart Analysis
(MACD & Stochastic)
Nifty-EOD Chart (30-Jul-2021):-

Technical Patterns and Formations in EOD charts
1- Impulsive Wave-5 continuation with recent high and new life time top formation at 15962.30 on 16-07-2021
2- Stochastic %K(5) is at 61.67 & %D(3) is at 59.56
3- Stochastic- Both %K(5) line and %D(3) line are kissing just above equilibrium line.
4- In MACD- Both MACD line and Average line are kissing just above zero line.
5- Last 43 sessions sideways trading between 15451-15962 from 01-06-2021 to 30-07-2021
Conclusions from EOD chart
analysis(Stochastic & MACD)
Same situation in Stochastic and MACD because in these 2 indicators both lines kissing just above equilibrium line therefore it will be understood that at present Indian markets are directionless and preparing next big moves as well as it will be done in the coming week.
Nifty-Last 2 Sessions
intraday charts analysis
Nifty-Intra Day Chart (Jul 29 & Jul 30,2021):-

Technical Patterns formation in last 20 Sessions intraday charts
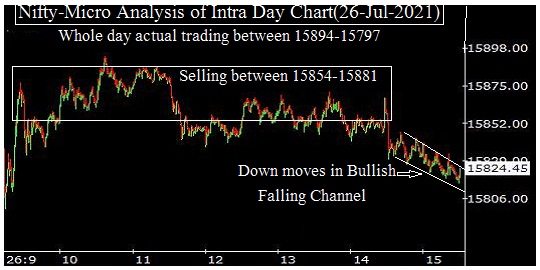
1- Volatility in first hour on 29-07-2021
2- Sharp up on 29-07-2021
3- Selling between 15783-15817 on 29-07-2021
4- Selling between 15794-15820 on 30-07-2021
5- Volatility in last 2 hours on 30-07-2021
6- Last 2 Sessions actual trading between 15738-15862
Conclusions from 2 Sessions
intra day chart analysis
More than 8 hours selling between 15783-15820 in last 2 sessions and closing was also below it at 15763.05 last Friday but high volatility was also seen in last 2 hours on 30-07-2021. As technical positions reverses during such high last Friday like high volatility in which
1- Nifty formed last 2 sessions intraday highest and
2- also Nifty came near to last 2 sessions lowest
Therefore firstly sustaining beyond last 2 sessions trading range(15738-15862) should be watched in the coming week for next decisive moves beginning confirmations.
Conclusions
(After Putting All Studies Together)
1- Long Term Trend is up
2- Intermediate Term Trend is sideways between 15451-15962 for the last 43 sessions(Jun 01 to Jul 30,2021)
3- Short Term Trend is sideways between 15579-15962 for the last 28 sessions(Jun 22 to Jul 30,2021)
Next resistances within last 43 Sessions trading range are as follows:-
A- 15783-15820
B- 15854-15890(Strong resistances)
C- 15921-15962(Strong resistances)
Next supports within last 43 Sessions trading range are as follows:-
A- 15606-15661
B- 15542-15579
C- 15460-15537(Strong supports)
Bullish rally is very much on and Long Term Trend is up also but Intermediate Term Trend is sideways between 15451-15962 for the last 43 sessions from Jun 01 to Jul 30,2021 and Nifty is preparing next big moves within this range.
Next 3 supports and resistances have been updated above which are equally strong therefore firstly Nifty will have to prepare for those big moves within last 43 sessions trading range and that will be done in the coming week/weeks as well as until Nifty will not sustain beyond it or forcefully break out/down it till then we shall not get confirmations of those big moves.
As 43 sessions like big trading range and its break out/down will certainly generate one sided big moves as well as form next trend therefore let it happen then next trend will get confirmations according to its break out/down direction and till then Outlook should remain Short Term and within last 43 sessions trading range.