Nifty-Intra Day Chart(11-Aug-2011):-
 |
| Just click on chart for its enlarged view |
1- Buying between 5131-5146
2- Selling between 5162-5183
3- Whole day trading between 5130-5183
Conclusions
Following line was told in today Either Uptrend Survival at 5171 or Repetition of 2008:-
Yesterday trading range(5125-5185) is trend decider
&
Today - High and Low are 5184.95-5121.00
Today achual trading range is- 5130-5183
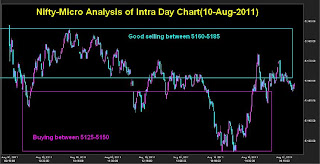
Nifty traded yesterday between 5125-5185 with following trading positions:-
1- Good selling between 5160-5185
2- Buying between 5125-5150
Nifty-Intra Day Chart(10-Aug-2011):-
 |
| Just click on chart for its enlarged view |
1- Buying between 5125-5150
2- Selling between 5160-5185
Clear selling at higher levels and buying at lower levels in 2 previous sessions therefore 2 previous sessions trading range(5125-5185) break out will give next big moves confirmations.
It will be safer and the best to get next moves indication and confirmation from breaking out and sustaining beyond mentioned range(5125-5185)

