

ॐ ह्रीं श्रीं लक्ष्मीभयो नमः॥

FII & DII trading activity in Capital Market Segment on 11-Jan-2012
| ||||||||||||||||
| ||||||||||||||||
Indian Stock Markets Closing Reports(11-Jan-2012)
1- Benchmark Indices closed flat.
2- Doji Candle.
3- Some Indices closed with good gains,some with losses and some flat today.
Ratios
Nifty Put Call Ratio: 1.00
Nifty P/E Ratio(11-Jan-2012):17.61
Advances & Declines
BSE Advances : 1880
BSE Declines : 951
NSE Advances : 1009
NSE Declines : 452
Nifty Open Interest Changed Today
Nifty- 4700 CE(Jan)- -120500(-4.62%)
Nifty- 4700 PE(Jan)- +458150(+7.21%)
Nifty- 4800 CE(Jan)- -63150(-1.70%)
Nifty- 4800 PE(Jan)- +626300(+14.27%)
Nifty- 4900 CE(Jan)- +1051700(+21.19%)
Nifty- 4900 PE(Jan)- +435100(+23.53%)
Closing
Nifty- closed at 4,860.95(+11.40 Points & +0.24%)
Sensex- closed at 16,175.86(+10.77 Points & +0.07% )
CNX Midcap - closed at 6,547.15(+79.60 Points & +1.23%)
BSE Smallcap- closed at 6,075.43(+78.95 Points & +1.32%)
Nifty Spot-Levels & Trading Strategy for 12-01-2012
R3 4913
R2 4895
R1 4877
Avg 4859
S1 4841
S2 4823
S3 4805
Nifty Spot-Trading Strategy
H6 4896 Trgt 2
H5 4887 Trgt 1
H4 4879 Long breakout
H3 4869 Go Short
H2 4866
H1 4863
L1 4856
L2 4853
L3 4850 Long
L4 4840 Short Breakout
L5 4832 Trgt 1
L6 4823 Trgt 2
Nifty(Jan Fut)-Levels & Trading Strategy for 12-01-2012
R3 4989
R2 4939
R1 4905
Avg 4855
S1 4821
S2 4771
S3 4737
Nifty(Jan Fut)-Trading Strategy
H6 4957 Trgt 2
H5 4937 Trgt 1
H4 4918 Long breakout
H3 4895 Go Short
H2 4887
H1 4879
L1 4864
L2 4856
L3 4848 Long
L4 4825 Short Breakout
L5 4806 Trgt 1
L6 4786 Trgt 2
Bank Nifty(Jan Fut)-Levels & Trading Strategy for 12-01-2012
R3 9067
R2 8974
R1 8914
Avg 8821
S1 8761
S2 8668
S3 8608
Bank Nifty(Jan Fut)-Trading Strategy
H6 9010 Trgt 2
H5 8974 Trgt 1
H4 8939 Long breakout
H3 8897 Go Short
H2 8883
H1 8869
L1 8840
L2 8826
L3 8812 Long
L4 8770 Short Breakout
L5 8735 Trgt 1
L6 8699 Trgt 2
Pre-Closing Outlook(11-01-2012)
As decisive big up moves were least expected today therefore we told following words in all outlooks which were updated for today market;-
next up moves are expected within couple of sessions.
As today intraday patterns are showing selling at higher levels also therefore down moves will also be considered after INFY quarterly results tomorrow. News based market will be seen tomorrow and 2 sessions are showing intraday mixed patterns therefore trading range of today and yesterday will be kept for next moves confirmations.
Firstly watch sustaining beyond 4814-4876 tomorrow for next moves confirmations.
Mid-session Outlook(11-01-2012)
Following lines were told at 05:51:00 AM today in Continuation of rally after minor correction
As mixed intra day patterns during 5 hours of trading on 10-01-2012 therefore consolidation is required and that may be seen between yesterday mixed patterns trading range also.
As was told same happened and Benchmark Indices firstly hovering around and consolidated near about yesterday closing and after that moved up. First 2 hours trading range is 4847-4864 and Nifty is trading above this range. Although some intraday volatility is expected but expected that rally will remain continued in Indian markets and next decisive up moves will be seen within couple of sessions.
Sustaining beyond 4847-4864 will be Next moves confirmation therefore should be firstly watched also in next couple of sessions because intraday selling signals at higher levels today.
Continuation of rally after minor correction
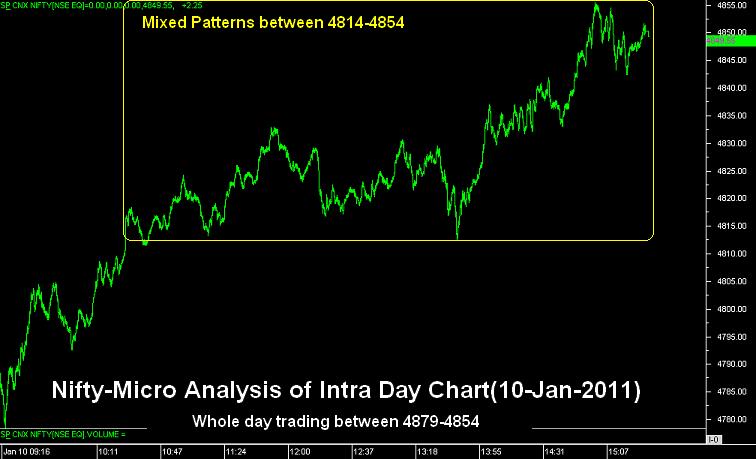
Nifty-Micro Analysis of Intra Day Chart For 11-01-2012
Nifty-Intra Day Chart(10-Jan-2011):-
Technical Patterns and Formations in today intraday charts
1- Whole day up moves.
2- Mixed Patterns between 4814-4854
3- Whole day trading between 4879-4854
Conclusions from intra day chart analysis
Long term and intermediate term trends are down while short term trend gave upward confirmation yesterday. Intermediate term trend will be up after sustaining above 5100. Long term trend and revival of bull markets hopes will be after sustaining above 200 Day EMA(today at 5148). As 200 Day SMA(today at 5251) has posed resistance 3 times earlier therefore sustaining above will be confirmation of up trend strength.
Expected that rally will remain continued but consolidation is required before each up move because multiple resistances at higher levels.As mixed intraday patterns during 5 hours of trading on 10-01-2012 therefore consolidation is required and that may be seen between yesterday mixed pattrens trading range also.
Opening will depend on global cues but expected that rally will remain continued in Indian markets and next up moves are expected within couple of sessions.
Although strong upmoves were seen on 10-Jan-2011 but it was projected more than 10 times in previous outlooks. For supports,resistances and detailed analysis just click following weekly analysis link which was updated on 07-1-2012
Nifty-Intra Day Chart(10-Jan-2011):-
 |
| Just click on chart for its enlarged view |
1- Whole day up moves.
2- Mixed Patterns between 4814-4854
3- Whole day trading between 4879-4854
Conclusions from intra day chart analysis
Long term and intermediate term trends are down while short term trend gave upward confirmation yesterday. Intermediate term trend will be up after sustaining above 5100. Long term trend and revival of bull markets hopes will be after sustaining above 200 Day EMA(today at 5148). As 200 Day SMA(today at 5251) has posed resistance 3 times earlier therefore sustaining above will be confirmation of up trend strength.
Expected that rally will remain continued but consolidation is required before each up move because multiple resistances at higher levels.As mixed intraday patterns during 5 hours of trading on 10-01-2012 therefore consolidation is required and that may be seen between yesterday mixed pattrens trading range also.
Opening will depend on global cues but expected that rally will remain continued in Indian markets and next up moves are expected within couple of sessions.
Although strong upmoves were seen on 10-Jan-2011 but it was projected more than 10 times in previous outlooks. For supports,resistances and detailed analysis just click following weekly analysis link which was updated on 07-1-2012

FII & DII trading activity in Capital Market Segment on 10-Jan-2012
| ||||||||||||||||
| ||||||||||||||||
Indian Stock Markets Closing Reports(10-Jan-2012)
1- All the Indices closed in Green with good gains.
2- Long White Candle.
3- Market showed good strength and Nifty crossed 1st strong resistance.
Ratios
Nifty Put Call Ratio: 1.02
Nifty P/E Ratio(10-Jan-2012): 17.56
Advances & Declines
BSE Advances : 2149
BSE Declines : 687
NSE Advances : 1229
NSE Declines : 237
Nifty Open Interest Changed Today
Nifty- 4700 CE(Jan)- -411750(-13.43%)
Nifty- 4700 PE(Jan)- +1292350(+24.35%)
Nifty- 4800 CE(Jan)- -524350(-11.97%)
Nifty- 4800 PE(Jan)- +2453900(+113.80%)
Nifty- 4900 CE(Jan)- +238850(+4.80%)
Nifty- 4900 PE(Jan)- +740950(+64.12%)
Closing
Nifty- closed at 4,849.55(+106.75 Points & +2.25%)
Sensex- closed at 16,165.09(+350.37 Points & +2.22% )
CNX Midcap - closed at 6,467.55(+151.50 Points & +2.40%)
BSE Smallcap- closed at 5,996.48(+153.95 Points & +2.63%)
Nifty Spot-Levels & Trading Strategy for 11-01-2012
R3 4967
R2 4911
R1 4880
Avg 4824
S1 4793
S2 4737
S3 4706
Nifty Spot-Trading Strategy
H6 4937 Trgt 2
H5 4917 Trgt 1
H4 4896 Long breakout
H3 4872 Go Short
H2 4864
H1 4856
L1 4841
L2 4833
L3 4825 Long
L4 4801 Short Breakout
L5 4780 Trgt 1
L6 4760 Trgt 2
Nifty(Jan Fut)-Levels & Trading Strategy for 11-01-2012
R3 5001
R2 4938
R1 4904
Avg 4841
S1 4807
S2 4744
S3 4710
Nifty(Jan Fut)-Trading Strategy
H6 4968 Trgt 2
H5 4946 Trgt 1
H4 4923 Long breakout
H3 4896 Go Short
H2 4887
H1 4878
L1 4861
L2 4852
L3 4843 Long
L4 4816 Short Breakout
L5 4793 Trgt 1
L6 4771 Trgt 2
Bank Nifty(Jan Fut)-Levels & Trading Strategy for 11-01-2012
R3 9124
R2 8949
R1 8854
Avg 8679
S1 8584
S2 8409
S3 8314
Bank Nifty(Jan Fut)-Trading Strategy
H6 9037 Trgt 2
H5 8972 Trgt 1
H4 8907 Long breakout
H3 8833 Go Short
H2 8808
H1 8783
L1 8734
L2 8709
L3 8684 Long
L4 8610 Short Breakout
L5 8545 Trgt 1
L6 8480 Trgt 2
Pre-Closing Outlook(10-01-2012)
Following line was told in Mid-session Outlook today
finally up moves above 4838 are expected
Nifty is trading above 4840 for the last half hour. Rally is on after 5 days consolidation and its continuation is expected in the coming sessions also.
finally up moves above 4838 are expected
Nifty is trading above 4840 for the last half hour. Rally is on after 5 days consolidation and its continuation is expected in the coming sessions also.
Mid-session Outlook(10-01-2012)
Nifty is trading between 1st resistance range(4780-4838) since opening and trading between 4815-4832 with mixed intraday patterns for the last 2 hours today.
As trading within crucial resistance range therefore more consolidation is required for next upmoves and 4815-4832 will be watched for next moves confirmations. Although finally up moves above 4838 are expected but mentioned range will also be watched for confirmations.
As trading within crucial resistance range therefore more consolidation is required for next upmoves and 4815-4832 will be watched for next moves confirmations. Although finally up moves above 4838 are expected but mentioned range will also be watched for confirmations.
Post-open Outlook(10-01-2012)
Anyone can verify from our previous outlooks that we told only and only for up moves and topic of weekly was:-
Bulls Will Welcome In Next Week
5 Sessions range forceful break out today and continuation of rally is expected.
Bulls Will Welcome In Next Week
5 Sessions range forceful break out today and continuation of rally is expected.
Accumulation of Exlosives between 4687-4794 to celetrate 2012
Technical Analysis,Researches & Market Outlook
(10-01-2012)
(10-01-2012)
Nifty-Intra Day Chart(09-Jan-2011):-
 |
| Just click on chart for its enlarged view |
1- Up moves in Rising trendline with support after every fall.
2- Rising trendline broken down in last hours.
3- Bullish Hammer Candle formation.
4- Whole day trading between 4698-4758
Conclusions from intra day chart analysis
Consolidation indications from intraday patterns and Bullish Hammer candle formation also today therefore continuation of previous month begun rally hopes are alive despite most of the time negative zone trading today.
Nifty-EOD Chart(09-Jan-2011):-
 |
| Just click on chart for its enlarged view |
1- Sub Wave 1(upmove) begun at 4532 on 20-12-2011
2- Sub Wave 1(upmove) completed at 4800 on 27-12-2011 and Sub Wave 2(its correction) begun.
3- Sub Wave 2(corrective) completed at 4589 on 02-01-2012 and Sub Wave 3(upmove) begun.
4- 6 sessions trading betwwn 27 Sessions trading range 4687-4794
Conclusions from EOD chart analysis
Exlplosives are being accumulated between 4687-4794 and blasting moves will be seen after forceful break out or sustaining beyond this range. As both selling at higher levels and buying at lower levels therefore more preparaion is required for decisive break out and expected that Nifty will firstly trade within mentioned range.
As more consolidation signals and intraday patterns within mentioned range(4687-4794) therefore its upward break out is expected in the coming sessions and for precaution sustaining beyond this range will be watched for confirmations.
Crucial levels have already been updated in Pre-Closing Outlook(09-01-2012) therefore not being repeated.

FII & DII trading activity in Capital Market Segment on 09-Jan-2012
| ||||||||||||||||
| ||||||||||||||||
Subscribe to:
Comments (Atom)