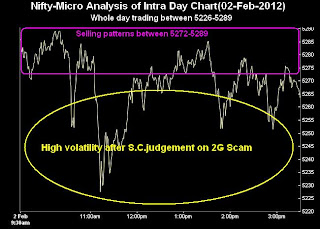
Nifty-Intra Day Chart(02-Feb-2012):-
1- Selling patterns between 5272-5289.
2- High volatility after S.C.judgement on 2G Scam.
3- Doji candle formation
4- Whole day trading between 5226-5289
Intraday supports at lower leves after high volatility due to negative news of S.C.judgement on 2G Scam but clear intraday selling patterns at higher levels also therefore minor intraday correction is due and that will be seen today.
 |
| Just click on chart for its enlarged view |
Technical Patterns and Formations in today intraday charts
1- Selling patterns between 5272-5289.
2- High volatility after S.C.judgement on 2G Scam.
3- Doji candle formation
4- Whole day trading between 5226-5289
Conclusions from intra day chart analysis
Intraday supports at lower leves after high volatility due to negative news of S.C.judgement on 2G Scam but clear intraday selling patterns at higher levels also therefore minor intraday correction is due and that will be seen today.

