

Technical Analysis,Researches & Market Outlook
(01-02-2012)
Nifty-EOD Chart(31-Jan-2012):-
 |
| Just click on chart for its enlarged view |
1- Rally is continued above rising trend line.
2- Rally closing near its top yesterday.
3- Nifty near the top of Trend Reversal 120 Sessions sideways market between 4720-5229.
4- Trend Reversal Broadening Pattern at the bottom of 14 months correction and it has also given strong support at lower levels to long term correction.
Conclusions from EOD chart analysis
Nifty above 5200 yesterday but when Nifty was below 4600 since then we projected rally and up moves more than 75 times as well as showed our full confidence in Bullish formations in above EOD Chart as well as we updated following conclusions:
More than 14 months long term correction and at its bottom huge 120 sessions above mentioned two trend reversal formations and they have complete strength to reverse whole long term correction.
Today anyone can say for rally but only we told non stop daily for that Rally which was seen in January 2012. When we told for correction of this rally then also it was seen on 30-01-2012
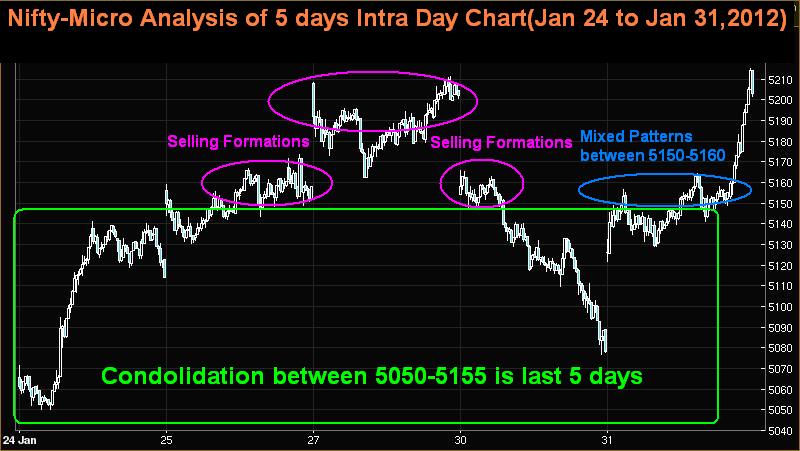
Nifty-Micro Analysis of 5 days Intra Day Chart
(Jan 24 to Jan 31,2012)
Nifty-Intra Day Chart(Jan 24 to Jan 31,2012):-
 |
| Just click on chart for its enlarged view |
1- Condolidation between 5050-5155 is last 5 days
2- Selling Formations also at higher levels.
3- Mixed Patterns between 5150-5160
4- 5 Sessions trading between 5050-5217.
Conclusions from 5 days intra day chart analysis
Resistances were as follows;-
1- 5070-5098
2- 5130-5225
3- 5260-5310
4- 5340-5375
Nifty has almost covered above mentioned first 2 resistances in last 5 sessions rally with lower levels good support but higher levels selling also within it.
Conclusions (After Putting All Studies Together)
Crucial Averages are as follows:
200-Day EMA is at-5131
200-Day SMA is at-5198(Nifty faced stiff resistance 3 times earlier)
We told only for very short term correction and it was seen on Monday and Rally is on after yesterday sharp surge. As higher levels selling in last 5 days and mixed intraday patterns also seen yesterday despite fast up moves above that therefore more consolidations are required for sustaining above the top(5217) of last 5 sessions.
Sustaining above 5217/5229 will mean blast rally after:-
1- Clearing of 3 times resistance(200-Day SMA)
2- Break out of 120 sessions trading range.
Since long telling only for strong rally above 5229 after break out and its possibility is high also but short term indicators are over bought and higher levels selling also in last 5 sessions therefore more consolidation as well as cooling down of indicators are firstly required in the coming sessions.
Expected that finally strong rally will be seen above 5229 but selling above 5150 in last 5 sessions therefore expected that Nifty will firstly trade between 5150-5217 and prepare for next moves and follow up buying/selling within this range will give next moves first indication and sustaining it beyond will be confirmations.
1- Above 5217 will mean strong rally after break out
2- Below 5150 will mean firstly short term correction and then rally after its completion.
3- Correction is completed in sideways in Bull markets therefore this possibility will also be kept in mind.