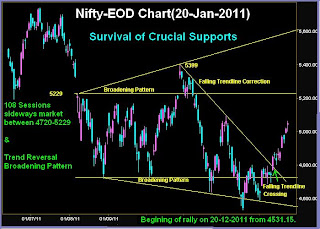
Nifty-EOD Chart(20-Jan-2011):-
 |
| Technical Patterns and Formations in EOD charts |
1- Trend Reversal Broadening Pattern at the bottom of 14 months correction is intact.
2- Trend Reversal 108 Sessions sideways market between 4720-5229 is intact.
3- Begining of rally on 20-12-2011 from 4531.15.
4- Falling Trendline Correction from 5399 and its upward cross over.
Conclusions from EOD chart analysis
Begining of rally on 20-12-2011 from 4531.15 after 14 Months correction and following points are showing indications of this long correction completion:-
1- Two above mentioned trend reversal patterns formations at the bottom of correction. As big 108 sessions patterns therefore its final break out moves will also be vast.
2- On going rally showed good strength after crossing and sustaining above falling Trendline.
3- On going rally commenced in the 13th month of correction and it is a Fibonacci number also therefore whole 14 months correction completion possibility in the 13th month is also alive

