

Nifty-1 Year EOD Chart(20-Jan-2011):-
Conclusions
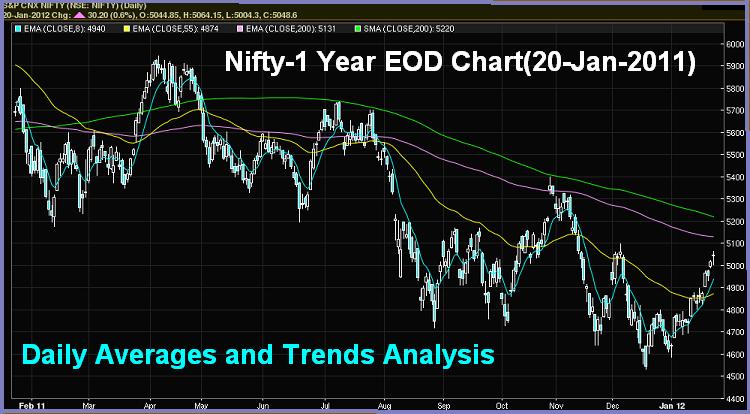
Trends & Averages(EMA-8,21,55,200)- Averages are as follows:
8-Day EMA is at- 4940
55-Day EMA is at- 4874
200-Day EMA is at-5131
200-Day SMA is at-5220
Short term trend is up and Intermediate term trend will be up above 5099. 8-Day EMA is rising as well as showed strength through moving above rising 55-Day EMA. First strong indication of long term trend turning up will be after moving above 200-Day EMA and confirmation will be after sustaining above 200-Day SMA because Nifty got stiff resistance at 200-Day SMA 3 times earlier.
 |
| Just click on chart for its enlarged view |
Trends & Averages(EMA-8,21,55,200)- Averages are as follows:
8-Day EMA is at- 4940
55-Day EMA is at- 4874
200-Day EMA is at-5131
200-Day SMA is at-5220
Short term trend is up and Intermediate term trend will be up above 5099. 8-Day EMA is rising as well as showed strength through moving above rising 55-Day EMA. First strong indication of long term trend turning up will be after moving above 200-Day EMA and confirmation will be after sustaining above 200-Day SMA because Nifty got stiff resistance at 200-Day SMA 3 times earlier.