Although higher levels selling today and previous 2 sessions but strong supports also at lower levels between 5779-5888 and some consolidation also seen at lower levels today therefore some up moves can not be ruled out between 5900-6050.

ॐ ह्रीं श्रीं लक्ष्मीभयो नमः॥

Mid-session Outlook-2(23-09-2013)
Correction continuation after higher levels selling today and previous 2 sessions but strong supports also at lower levels between 5779-5888,now trading within this range and finally sustaining beyond this range should be watched for deeper/sideways correction.
Mid-session Outlook(23-09-2013)
As on going rally completed 5 waves in its up moves therefore its correction was due and going on today. Nifty traded more than 1.5% down with lowest formation at 5907.35 which is just above 7 Sessions strong consolidation range(5779-5888) and until complete selling will not develop till then 5779 will not be broken down,sustaining beyond this range should be firstly watched for sideways or deeper correction.
Range Bound Market between 5779-6140 for Next Trend Preparation
Technical Analysis,Research & Weekly Outlook
(Sep 23 to Sep 27,2013)
Nifty-EOD Chart between 22-09-2003 and 20-09-2013):-
 |
| Just click on chart for its enlarged view |
1- 1300.25 on 22-09-2003.
2- 6357.10 on 08-01-2008(All time high formation)
3- 2252.75 on 27-10-2008
4- 6338.50 on 05-11-2010
5- 4531.15 on 20-12-2011
6- 200-Day DMA- Today at 5842
7- 200-Day EMA- Today at 5745
8- Hovering aroung Long Term Trend deciding 200-Day DMA and EMA
Conclusions from EOD chart analysis
All trends are up and last 3 sessions closing 200-Day DMA and EMA but hovering around it for the last 4 years with trading between 4531-6338.
Nifty-Weekly Chart (20-Sep-2013):-
 |
| Just click on chart for its enlarged view |
1- 2252.75 on 27-10-2008(Wave-1 begining after 2008 correction completion)
2- Impulsive Wave-1 Completion at 6338.50 on 05-11-2010.
3- Corrective Wave-2 completion at 4531.15 on 20-12-2011.
4- Impulsive Wave-3 Completion at 6229.45 on 20-05-2013.
5- Corrective Wave-4 completion at 5118.85 on 28-08-2013.
6- Impulsive Wave-5 continuation and its recent top formation at 6142.50 on 19-09-2013
7- 200-Week DMA- Today at 5459
8- 200-Week EMA- Today at 5333
Conclusions from Weekly chart analysis
Nifty got supports many times near about 200-Week DMA and EMA in last 3 years and Strong Rally seen after getting support at 5118.85 on 28-08-2013 as well as impulsive Wave-5 continuation but confirmation is required yet through sustaining above the top of Wave-3(6229.45).
Nifty-EOD Chart (20-Sep-2013):-
 |
| Just click on chart for its enlarged view |
1- 4531.15 on 20-12-2011(Rally beginning after 13 Months correction completion)
2- Wave-1(5629.95 on 22-02-2012)
3- Wave-2(4770.35 on 04-06-2012)
4- Wave-3(6111.80 on 29-01-2013)
5- Wave-4(5477.20 on 10-04-2012)
6- Wave-5(6229.45 on 20-05-2013)('ABC'Correction beginning after 17 Months Rally completion)
7- Wave-A(5566.25 on 24-06-2013)
8- Wave-B(6093.35 on 23-07-2013)
9- Wave-C(5118.85 on 28-08-2013)('ABC'Correction completion after 3 Months correction completion)
10- Strong Rally continuation and top formation at 6142.50 on 19-09-2013.
Conclusions from EOD chart analysis
Strong Rally continuation after 'ABC'Correction completion and recent top formation at 6142.50 on 19-09-2013.
Waves structure of on going 16 sessions strong Rally
Nifty-EOD Chart (20-Sep-2013):-
 |
| Just click on chart for its enlarged view |
1- Bottom formation at 5118.85 on 28-08-2013 and Wave-1 beginning
2- Wave-1(5580.95 on 03-09-2013)
3- Wave-2(5318.90 on 04-09-2013)
4- Wave-3(5957.25 on 16-09-2013)
5- Wave-4(5798.15 on 16-09-2013)
6- Wave-5 continuation and top formation at 6142.50 on 19-09-2013
Conclusions from EOD chart analysis
Huge gap up opening on 19-09-2013 after FOMC decision of not rushing to taper Bond buying programme and recent top formation at 6142.50 but sharp fall also seen on next day after RBI Credit policy but Wave-5 continuation will be understood until its completion confirmation will not be seen.
Nifty-Intra Day Chart (Sep 10 to Sep 20,2013):-
 |
| Just click on chart for its enlarged view |
1- 7 Sessions strong consolidation between 5779-5888
2- Selling between 6095-6140
3- 9 Sessions actual trading between 5779-6140
Conclusions from 9 Sessions intra day chart analysis
Although sharp fall seen on 20-09-2013 after some selling at higher levels in last 2 sessions but until complete selling will not develop till then Nifty will not slip below 5779 because huge gap up opening on 19-09-2013 after 7 sessions strong consolidation between 5779-5888.
3 Lower Tops and Resistances
Nifty-EOD Chart (20-Sep-2013):-
 |
| Just click on chart for its enlarged view |
1- 6357.10 on 08-01-2008(All time high formation)
2- 2nd Top formation at 6338.50 on 05-11-2010
3- 3rd Top formation at 6229.45 on 20-05-2013
4- Recent top formation at 6142.50 on 19-09-2013
Conclusions from EOD chart analysis
3 Lower tops formations in last 5 years and these levels are psychological resistances also therefore more consolidation is must for new all time high formations because higher levels selling seen just below above mentioned 3 tops in last 2 sessions.
Conclusions (After Putting All Indicators Together)
Last 16 sessions strong rally reversed whole sentiment from most Bearish to most Bullish and turned all trends up. As on going rally completed 5 waves in its 1023 points up moves therefore its correction is required and it would have begun also after last 2 sessions selling and slipping from higher levels.
As rally started after completion of 'ABC' correction of Wave-4 therefore up moves above Wave-3 top(6229.45) will be expected but more condolidation is also required because resistances of 3 Lower tops formations in last 6 years and higher levels selling also in last 2 sessions as well as correction of last 16 sessions 1023 points rally is also due.
Higher levels selling between 6095-6140 in last 2 sessions but 7 sessions good consolidation between 5779-5888 therefore Nifty will not slip below it easily and until Nifty is above 5779 till then on going rally is very much safe. Expected that Nifty will firstly trade between 9 Sessions actual trading range(5779-6140) and it should be kept in mind that Bull markets complete its correction in range bound markets also therefore sustaining beyond this range should be watched in the coming week for correction completion/continuation. It is confirm that until complete selling patterns will not develop on Daily charts till then deeper correction will not be seen and Nifty will remain above 5779.
Nifty is trading between 4531-6338 for the last 4 years and finally sustaining beyond this range will form new cycle as was formed in late 2003 after break out of previous 11 years range. As Wave-5 is on therefore rally above 6338 can not be ruled out in the coming weeks/months but complete consolidation is must because multiple resistances upto 6338.
Nifty will prepare for next trend between 5779-6140 in the coming week/weeks and finally sustaining beyond this range should be watched for next trend confirmations.
Post-open Outlook(13-09-2013)
Although all the Asian were sufficiently down and SGX Nifty was also trading more than 60 points weak but Indian markets were not prepared for any side decisive moves therefore Nifty recovered strongly after formation of lowest at 5822.90. Following conclusive lines were told yesterday in previous Outlook and should be kept in mind:-
Let market prepare for next trend within mentioned range then will be updated according to intraday charts formations.
Expected that Nifty will firstly trade and prepare for next decisive moves near about 5917-5924 and sustaining beyond this range should be firstly watched in the coming sessions for Long Term Trend confirmations.
Let market prepare for next trend within mentioned range then will be updated according to intraday charts formations.
Technical Analysis and Market Outlook(13-09-2013)
Nifty-Intra Day Chart (12-Sep-2013):-
Technical Patterns and Formations in today intraday charts
1- Down moves in Falling channel with both minor selling and some supports also.
2- Lower levels supports in last hour between 5917-5935
3- Whole day actual trading between 5917-5904
Following line was told yesterday in Emergence of Correction Possibility:-
1- more possibility of down moves below 5835 in the coming sessions.
2- possibility of firstly trading between today trading range(5835-5924)
Although more than 5 hours continuous down moves immediately after opening today but without as such selling patterns formations and it was updated also in both previous Outlooks resultant lower levels support in last hour and Nifty recovered more than 45 points.
Intermediate and Short Term Trends are up and Long Term Trend will be up after the confirmation of sustaining above its decider 200-Day EMA(today at 5734). As last 2 sessions trading between 5917-5924 with both selling and buying therefore firstly one sided positions formations are required for next decisive trend. Expected that Nifty will firstly trade and prepare for next decisive moves near about 5917-5924 and sustaining beyond this range should be firstly watched in the coming sessions for Long Term Trend confirmations.
 |
| Just click on chart for its enlarged view |
1- Down moves in Falling channel with both minor selling and some supports also.
2- Lower levels supports in last hour between 5917-5935
3- Whole day actual trading between 5917-5904
Conclusions from intra day chart analysis
Following line was told yesterday in Emergence of Correction Possibility:-
1- more possibility of down moves below 5835 in the coming sessions.
2- possibility of firstly trading between today trading range(5835-5924)
As was told yesterday 100% same happened today and almost whole day down moves were seen as well as Nifty slipped below 5935,Nifty traded most time and closed within already mentioned range(5835-5924) also.
Although more than 5 hours continuous down moves immediately after opening today but without as such selling patterns formations and it was updated also in both previous Outlooks resultant lower levels support in last hour and Nifty recovered more than 45 points.
Intermediate and Short Term Trends are up and Long Term Trend will be up after the confirmation of sustaining above its decider 200-Day EMA(today at 5734). As last 2 sessions trading between 5917-5924 with both selling and buying therefore firstly one sided positions formations are required for next decisive trend. Expected that Nifty will firstly trade and prepare for next decisive moves near about 5917-5924 and sustaining beyond this range should be firstly watched in the coming sessions for Long Term Trend confirmations.
Pre-closing Outlook(12-09-2013)
Although possibility of down moves below 5835 was told yesterday and now Nifty is trading below it also after formation of lowest at 5815.80 but sustaining below 5835 should be firstly watched tomorrow for decisive down moves confirmations because as such selling patterns not seen today.
Mid-session Outlook(12-09-2013)
Although most time negative zone trading today but as such selling not seen and some supports also seen at lower levels therefore mixed patterns formations today and yesterday between 5835-5924,follow up moves in the coming hours and finally valid break out of 5835-5924 will be firstly watched now for next immediate moves confirmations.
Post-open Outlook(12-09-2013)
Nifty started to trade in Red immediately after opening today but we told following lines for down moves yesterday in both previous Outlooks:-
1- In Pre-closing Report(11-09-2013):-As more selling formations today therefore correction beginning possibilities turned alive today.
2- In Energence of Correction Possibility:- As more selling seen at higher levels today therefore more possibility of down moves below 5835 in the coming sessions.
Although possibility of down moves below 5835 was also told but follow up selling is also must therefore firstly Follow up technical positions formations in the coming hours and finally valid break out of 5835-5924 should be watched in the coming sessions for next immediate moves confirmations because minor support also seen at lower levels today.
Emergence of Correction Possibility
Technical Analysis and Market Outlook(12-09-2013)
Nifty-Intra Day Chart (11-Sep-2013):-
 |
| Just click on chart for its enlarged view |
1- Selling between 5878-5924
2- Support between 5835-5860
3- Whole day actual trading between 5835-5924
Conclusions from intra day chart analysis
Range bound trading today between 5835-5924 with higher levels selling and lower levels supports therefore possibility of firstly trading between today trading range(5835-5924) but more selling seen therefore emergence of correction beginning possibilities turned alive today. As selling is not sufficient today therefore more selling is required because complete selling is required for decisive down moves after 805 points strong rally in last 10 sessions.
Follow up moves near about today trading range and finally sustaining beyond 5835-5924 should be watched in the coming sessions for next immediate moves confirmations. As more selling seen at higher levels today therefore more possibility of down moves below 5835 in the coming sessions.
Pre-closing Report(11-09-2013)
Range bound trading today between 5836-5924 with selling indications but not sufficient and more selling is required because complete selling is required for decisive down moves after 794 points strong rally in 9 sessions. Nifty is trading near the higher levels of today and some supports also seen at higher levels therefore firstly sustaining beyond 5836-5924 should be watched for next immediate moves confirmations. As more selling formations today therefore correction beginning possibilities turned alive today.
Mid-session Outlook(11-09-2013)
Nifty forcefully crossed Long Term Trend decider 200 Day EMA(today at 5731) yesterday and most time negative zone trading today after 594 points rally in 5 sessions therefore today trading will be understood only technical correction. As indicators are overbought therefore 1/2 sessions intraday correction is very much possible and being seen today but It is confirm that complete selling patterns are required for sustaining below 5731.
Nifty traded 3%(5902) above of 200 Day EMA(today at 5731) which is confirmation level of Long Term Trend turning up and firstly sustaining beyond 5902 should be watched in the coming 2/3 sessions for:-
1- 100% Confirmaton of all trends turning up above 5902 or
2- 1st Indication of again decisive down moves below 5902 but confirmation will be after sustaining below 5731.
Technical Analysis and Market Outlook(06-09-2013)
Nifty-Intra Day Chart (05-Sep-2013):-
 Just click on chart for its enlarged view
Technical Patterns and Formations in today intraday charts
1- Bullish Falling Channel formations
2- Whole day actual trading between 5554-5611
Conclusions from intra day chart analysis
Whole day trading at more than 2% upward levels with Bullish Falling Channel formations therefore technically signal of up moves continuation. As such higher levels trading were on the back of most Bullish and much awaited Pension Bill passing news therefore next trend confirmations is also required through sustaining beyond 5554-5611 because Nifty traded whole day within this range today amid Bullish sentiments.
Post-open Outlook(05-09-2013)
As much awaited Pension Bill passed in Lok Sabha yesterday therefore huge gap up opening and slipping below next trend decider 5605 after high formation at 5625.75. Most fluctuating news led highly volatile all Global financial markets nowadays and sustaining beyond 5605 should be firstly watched now for Intermediate Term Trend turning up confirmations.
Next Trend decider at 5605 after passing of Pension Bill in Lok Sabha
Nifty-Intra Day Chart (04-Sep-2013):- |
| Just click on chart for its enlarged view |
1- Consolidation between 5376-5420
3- Whole day actual trading between 5376-5460
Conclusions from intra day chart analysis
Good consolidation at lower levels of the day and closing near the highs of the day after strong opening yesterday therefore positive market is expected today. It should be kept in mind that all the financial markets are highly volatile nowadays due to uncertainty on Syria issue. Its few examples are as follows:-
1- Gold increased Rs 1800/- on 2nd and 3rd Sep but down Rs 1803/- yesterday.
2- Gold increased almost Rs 4000/- on 2nd and 3rd Sep but down Rs 4120/- yesterday.
3- Crude increased Rs 490/- on 2nd and 3rd Sep but down Rs 366/- yesterday.
4- Copper increased Rs 25/- on 2nd and 3rd Sep but down Rs25.95/- yesterday.
5- Nickel increased Rs 30/- on 2nd and 3rd Sep but down Rs36.20 yesterday.
6- Aluminium increased Rs 4.95 on 2nd and 3rd Sep but down Rs6.25 yesterday.
7- USDINR increased Rs 2.05 on 2nd and 3rd Sep but down Rs .60 yesterday after slipping Rs 1.50 from intraday higher levels.
As Global and local news led high volatility therefore cautious view is required.
Most Asian markets are trading with good gains after positive closing in US markets yesterday therefore sentiment boosted today morning and gap up opening will be seen in Indian markets. As Land Acquisition Bill passed in Rajya sabha and Lok Sabha clears pension bill(foreign investors can hold 26% stake) yesterday therefore sentiment is most strong in Indian markets and expected that good gains will be seen in Indian markets. Next Resistances are as follows:-
1- 5490-5528
2- 5530-5605
As most Bullish sentiment because Congress and BJP joined hands to pass much awaited Pension Bill in Lok Sabha therefore now sustaining beyond 5605 should be watched in the coming sessions for next big trend confirmations.
More specific micro levels,predictions at yours Email ID & Some trading calls(SMS) of Nifty Fut & Options
Market Outlooks with more specific micro levels,predictions and most useful Analytical points(conclusive study material) for Technical and Intraday Charts Analysis Students at yours Email as well as some trading calls of Nifty Fut & Options with covering messages(2 SMS for each call) at yours mobile at Rs 5000/- per month. Just subscribe and send following details to lalitdhingra@yahoo.com :-
1- Name:
2- Email ID:
3- Mob No:
For Bank details just click following link:-
http://enjoydailyprofits.blogspot.in/2010/05/page-no-12.html
2 SMS will be sent on yours Mobile after sending of all Outlooks on yours Email & 2 SMS will be sent on yours Mobile for each Trading Call and Covering Message
Live Proofs 100% Accurate predictions of Indian Markets
Although Indian Rupee is more than 1.25% weak but SENSEX is 160 and Nifty is 49 points UP as well as proved 100% Accurate predictions our following prediction which was updated yesterday in Technical Analysis and Market Outlook(04-09-2013):-
intraday bounce from intraday lower levels is possible tomorrow
Not only yesterday but 'Archive' with 'more than 6500 posts' at the bottom of Blog' is live proof of "many hundreds" such accurate and miraculous predictions in last 4 years. Anyone can verify this facts anytime from the Blog 'Archive'.
Not only yesterday but 'Archive' with 'more than 6500 posts' at the bottom of Blog' is live proof of "many hundreds" such accurate and miraculous predictions in last 4 years. Anyone can verify this facts anytime from the Blog 'Archive'.
Live Proofs 100% Accurate predictions of Asian Markets From Intraday Charts
Following lines were told yesterday in Technical Analysis and Market Outlook(04-09-2013):-
1- Asian markets intraday charts are showing selling patterns formations today
2- expected that most Asian markets will be weak tomorrow morning
As was told 100% same happened and all the Asian markets are trading in Red after Gap down opening:-
1- Japan 225- 104 Points down
2- Hang Sen 40(Hongkong)- 207 Points down
3- KOSPI(Koria) 5.2 Points down
4- TWII(Taiwan)- 21 Points down
5- STI(Singapur)- 28 Points down
We guarantee that such exact analysis and accurate predictions of Nifty will not be available in any other website and Business news channel in whole India
Technical Analysis and Market Outlook(04-09-2013)
Nifty-Intra Day Chart (03-Sep-2013):-
Technical Patterns and Formations in today intraday charts
1- Selling between 5484-5520
2- Minor supports between 5398-5410.
3- Last hour fall after the news of US Missile attack on Syria
3- Whole day actual trading between 5323-5560
All previous Outlooks are live proofs of this fact that we updated only Bearish views and resultant huge fall seen in Indian markets today despite strong up moves in Asian markets. Continuous higher levels selling and minor support was seen but sharp fall in last hour after the news of US Missile attack on Syria which proved false after market hours.
Although most Asian markets closed in Green and some closed with good gains today but Asian markets intraday charts are showing selling patterns formations today therefore expected that most Asian markets will be weak tomorrow morning and sentiment may be depressed tomorrow morning therefore weak opening can not be ruled out in Indian markets. As hourly indicators are oversold and Missile attack news led weaker hands selling can not be ruled out in last hour therefore intraday bounce from intraday lower levels is possible tomorrow but expected that Nifty will not be able to sustain above next resistance range(5484-5520)
 |
| Just click on chart for its enlarged view |
1- Selling between 5484-5520
2- Minor supports between 5398-5410.
3- Last hour fall after the news of US Missile attack on Syria
3- Whole day actual trading between 5323-5560
Conclusions from intra day chart analysis
All previous Outlooks are live proofs of this fact that we updated only Bearish views and resultant huge fall seen in Indian markets today despite strong up moves in Asian markets. Continuous higher levels selling and minor support was seen but sharp fall in last hour after the news of US Missile attack on Syria which proved false after market hours.
Although most Asian markets closed in Green and some closed with good gains today but Asian markets intraday charts are showing selling patterns formations today therefore expected that most Asian markets will be weak tomorrow morning and sentiment may be depressed tomorrow morning therefore weak opening can not be ruled out in Indian markets. As hourly indicators are oversold and Missile attack news led weaker hands selling can not be ruled out in last hour therefore intraday bounce from intraday lower levels is possible tomorrow but expected that Nifty will not be able to sustain above next resistance range(5484-5520)
Mid-session Outlook-2 (03-09-2013)
Whole day down moves but minor supports at lower levels between 5398-5410 therefore some up moves can not be ruled out but expected that will not be able to sustain above next resistance range(5484-5510).
Mid-session Outlook(03-09-2013)
Following conclusive lines were told yesterday in Technical Analysis and Market Outlook(03-09-2013):-
1- expected that fresh down moves will begin after follow up selling in the coming 1/2 sessions.
2- sustaining below 5490 will mean fresh down moves after completion of ongoing rally
Fresh down moves seen immediately after opening and Nifty slipped 97 points from higher levels as well as traded more than 1% down within first 50 minutes despite most Asian were in Green and some were more than 1% up. Nifty is trading between 5483-5510 for the last 1 hour and sustaining below 5490 should be firstly watched now because that will be strong indication of Pull Back Rally completion.
Technical Analysis and Market Outlook(03-09-2013)
Nifty-Intra Day Chart (02-Sep-2013):-
Technical Patterns and Formations in today intraday charts
1- Support between 5500-5530
2- Mixed patterns between 5527-5564
3- Whole day actual trading between 5490-5564
Sentiment sparked today morning after delaying of US Attack on Syria news and Dow's Futures trading more than 80 points up therefore most Asian markets traded and closed strong as well as gap up opening in European markets resultant whole day positive zone trading and closing with good gains in Indian markets today.
Firstly lower levels support between 5500-5530 but last 3 hours trading with mixed patterns between 5527-5564 therefore firstly follow up moves and after that valid break out of this range should be watched tomorrow for next immediate moves confirmations. Next resistance range was between 5530-5605 and Nifty traded between this range today but more strong resistances are within this range are between 5580-5605 therefore complete consolidation is required for decisive strong up moves after Intermediate Term Trend turning into up zone above 5605.
 |
| Just click on chart for its enlarged view |
1- Support between 5500-5530
2- Mixed patterns between 5527-5564
3- Whole day actual trading between 5490-5564
Conclusions from intra day chart analysis
Sentiment sparked today morning after delaying of US Attack on Syria news and Dow's Futures trading more than 80 points up therefore most Asian markets traded and closed strong as well as gap up opening in European markets resultant whole day positive zone trading and closing with good gains in Indian markets today.
Firstly lower levels support between 5500-5530 but last 3 hours trading with mixed patterns between 5527-5564 therefore firstly follow up moves and after that valid break out of this range should be watched tomorrow for next immediate moves confirmations. Next resistance range was between 5530-5605 and Nifty traded between this range today but more strong resistances are within this range are between 5580-5605 therefore complete consolidation is required for decisive strong up moves after Intermediate Term Trend turning into up zone above 5605.
As mixed trading patterns in last 3 hours therefore follow up selling and sustaining below 5490 will mean fresh down moves after completion of ongoing rally and expected that fresh down moves will begin after follow up selling in the coming 1/2 sessions.
Mid-session Outlook(02-09-2013)
As US Attack on Syria delayed therefore all the Asian markets are trading strong since opening today and Dow's Futures is also more than 80 points up since today morning. Resultant sentiment improved and Indian markets are more than 1.5% up and now trading within resistance range(5530-5605). Short Term Trend is up and Intermediate term will be up after sustaining above 5605.
Good consolidation at lower levels today but any decisive rally will be considered only after sustaining above 5605.
Good consolidation at lower levels today but any decisive rally will be considered only after sustaining above 5605.
Range Bound week ahead before next Big Trend
Technical Analysis,Research & Weekly Outlook
(Sep 02 to Sep 06,2013)
Nifty-EOD Chart (30-Aug-2013):-
 |
| Just click on chart for its enlarged view |
1- Wave-5 completion at 6229.45 on 20-05-2013 and 'ABC' correction continuation.
2- Wave-A(5566.25 on 24-06-2013)
3- Wave-B(6093.35 on 23-07-2013)
4- Wave-C bottom formation at 5118.85 on 28-08-2013
5- Pull Back Rally recent top formation at 5493.20 on 30-08-2013.
Conclusions from EOD chart analysis
As correction started after Wave-5 completion at 6229.45 therefore correction possibility of whole rally between 4531.15-6229.45 with its retracement levels were updated on 31-07-2013 in Technical Analysis and Market Outlook(31-07-2013) and its 61.8%(5179) retracement has been completed after bottom formation at 5118.85 on 28-08-2013. 'ABC' correction is on and now Pull Back Rally continuation after Wave-C bottom formation at 5118.85 therefore following retracement levels of its whole Wave-C down moves(6093-5118) should be firstly watched:-
23.6%-5348(retracement completed)
38.2%-5490(retracement completed)
50.0%-5605
61.8%-5720
76.4%-5862
38.2% retracement of on going Pull Back Rally has been completed after top formation at 5493.20 on 30-08-2013. More than 4% crash was seen on 16-08-2013 and after that Nifty traded most time between 5118-5605 in last 11 sessions therefore firstly technical positions of last 11 trading sessions should be understood for deciding next trend:-
Nifty-Intra Day Chart (Aug 16 to Aug 30,20133):-
 |
| Just click on chart for its enlarged view |
1- Selling between 5530-5605 on 16-08-2013
2- Selling between 5490-5528 on 26-08-2013
3- Selling between 5438-5466 on 30-08-2013
4- Consolidation between 5270-5325 on 22-08-2013
5- Consolidation between 5123-5200 on 28-08-2013
6- Lower tops and lower bottoms formations in last 11 sessions
Conclusions from 11 Sessions intra day chart analysis
Although supports at lower levels but good selling at higher levels with lower tops and lower bottoms formations in last 11 sessions therefore down moves are expected after follow up selling in the coming sessions.
Nifty-Intra Day Chart (30-Aug-2013):-
 |
| Just click on chart for its enlarged view |
1- Selling between 5438-5466.
2- Support between 5360-5390.
3- High intraday volatility.
3- Whole day actual trading between 5360-5493
Intra Day connection between Nifty andChart on 30-Aug-2013:-
 |
| Just click on chart for its enlarged view |
Firstly good selling at higher levels in more than 2 hours but lower levels some supports also seen. Although closing near higher levels of the day but whole day intraday moves of Nifty were directly effected by moves of Indian Rupee(USDINR) and in the last minutes also Nifty formed new intraday high after new intraday low formation by USDINR therefore new intraday high formation of Nifty will be understood only sentiments driven and Until Nifty will not sustain above the highest of day till then any decisive up move will not be considered.
Conclusions (After Putting All Indicators Together)
Following support levels upto 4779 were updated on 19-08-2013 in Huge Bearish Pattern formation in last 11 months:-
1- 5210-5270
2- 5075-5140
3- 4779-4880
Nifty got supports between 2nd support range at 5118.85 on 28-08-2013 and reversed as well as Pull Back Rally seen and its recent top formation at 5493.20 on 30-08-2013 but hurdles in the way of on going Pull Back Rally through following immediate resistances:-
1- 5490-5528
2- 5530-5605
Following Bullish formations also seen on Daily/Weekly charts and indicators:-
1- Bullish Hammer formation in last 2 weeks.
2- Weekly closing near the higher levels in last 2 weeks.
3- Last 2 weeks trading and closing near the lower Band of Daily and Weekly Bollonger Band.
4- Lower levels supports in last 11 sessions.
5- Daily oscillators are oversold and showing up moves indications
6- Weekly Stochastics has moved into oversold zone and showing up moves indications
More than 4% crash on 16-08-2013 and after that Nifty traded most time between 5118-5605 in last 11 sessions therefore final break out of this range will result next big moves. Although Daily oscillators are oversold and showing up moves indications but above mentioned good resistances are at higher levels also therefore more consolidation is required for any decisive up move. Expected that Nifty will firstly trade between 5118-5605 in the coming week/weeks and prepare for next trend. As weekly indicators are not oversold and weekly MACD have moved below Zero line as well as Daily indicators have not shown positive divergence yet therefore down move are expected within last 11 sessions range(5118-5605).
As huge Bearish pattern formation in last 11 months on Daily and Weekly charts therefore expected that finally down moves will be seen below 5118 after follow up selling in the coming sessions and weeks but next week will remain most time range bound between 5118-5605 and Indian markets will prepare for next big Trend because both lower levels supports and higher levels selling in last 11 sessions.
Live Proofs of 100% accurate Stock Market predictions
Following conclusive lines were told yesterday in Technical Analysis and Market Outlook(30-08-2013):-1- next strong resistance is between 5490-5528 and until Nifty will not sustain above 5528 till then any big up move will not be considered.
2- today started up moves continuation will be firstly seen tomorrow
3- high possibility of rally completion near about mentioned resistance range(5490-5528) in the coming 2/3 sessions.
Following conclusive lines were told today in Pre-open Outlook(30-08-2013):-
1- sustaining above 5400 will mean rally continuation toward next strong resistance range(5490-5528).
2- high possibility of rally completion in the coming 2/3 sessions and maximum up moves of on going rally are expected upto 5528
As was told 100% same happened and firstly up moves seen but could not touch mentioned strong resistance range(5490-5528) as well as sharp down moves seen from 5469.10
Pre-open Outlook(30-08-2013)
US markets closed flat after loosing intraday gains yesterday therefore resultant Asian markets are mixed and trading with small gains/loss. Sentiment quiet today morning therefore flat opening and firstly trading is expected between 5355-5428. Mixed trading patterns were seen between 5355-5400 yesterday and follow up moves within or near about this range will decide next Short Term Trend. It should be kept in mind that Pull Back Rally is on,Short Term Trend is up and sustaining above 5400 will mean rally continuation toward next strong resistance range(5490-5528). Intermediate Term Trend will be up after sustaining above 5528 but high possibility of rally completion in the coming 2/3 sessions and maximum up moves of on going rally are expected upto 5528 as well as sustaining below 5355 will mean Pull Back Rally completion. Next Trend confirmation ranges are as follows:-
1- Short Term Trend confirmation range-5355-5428
2- Intermediate Term Trend confirmation range-5490-5528
1- Short Term Trend confirmation range-5355-5428
2- Intermediate Term Trend confirmation range-5490-5528
Technical Analysis and Market Outlook(30-08-2013)
Nifty-Intra Day Chart (29-Aug-2013):-
Technical Patterns and Formations in today intraday charts
1- Lower levels supports.
2- Higher levels mixed intraday patterns
3- Whole day actual trading between 5303-5428
As strong opening of Indian Rupee and some up moves in global markets therefore sentiment improved and firstly lower levels supports after gap up opening and whole day continuous up moves as well as Nifty sustains above immediate resistance(5355). Pull Back Rally continuation,next strong resistance is between 5490-5528 and until Nifty will not sustain above 5528 till then any big up move will not be considered.
Indian markets got good supports at lower levels supports yesterday and until equally good selling will not develop till then on going rally will not terminate. Expected that today started up moves continuation will be firstly seen tomorrow and also high possibility of rally completion near about mentioned resistance range(5490-5528) in the coming 2/3 sessions.
 |
| Just click on chart for its enlarged view |
1- Lower levels supports.
2- Higher levels mixed intraday patterns
3- Whole day actual trading between 5303-5428
Conclusions from intra day chart analysis
As strong opening of Indian Rupee and some up moves in global markets therefore sentiment improved and firstly lower levels supports after gap up opening and whole day continuous up moves as well as Nifty sustains above immediate resistance(5355). Pull Back Rally continuation,next strong resistance is between 5490-5528 and until Nifty will not sustain above 5528 till then any big up move will not be considered.
Indian markets got good supports at lower levels supports yesterday and until equally good selling will not develop till then on going rally will not terminate. Expected that today started up moves continuation will be firstly seen tomorrow and also high possibility of rally completion near about mentioned resistance range(5490-5528) in the coming 2/3 sessions.
Sustaining beyond 5490-5528 should be watched in the coming sessions for next Intermediate Term Trend confirmations.
Mid-session Outlook-2(29-08-2013)
Following lines were told at 11:13 AM in previous Outlook:-
1- Green Indian markets since opening with lower levels supports and without selling signal
2- Nifty will firstly prepare for next decisive moves between 5295-5355 therefore follow up moves in the coming hours and valid break out of mentioned range should be watched for confirmation.
As lower levels supports and no selling therefore yesterday started up moves continuation above 5355 but sustaining above 5355 should also be watched for minimum a Pull Back Rally confirmations.
Mid-session Outlook(29-08-2013)
As strong opening of Indian Rupee and some up moves in global markets therefore sentiment improved and Green Indian markets since opening with lower levels supports and without selling signal. Expected that Nifty will firstly prepare for next decisive moves between 5295-5355 therefore follow up moves in the coming hours and valid break out of mentioned range should be watched for confirmation.
Technical Analysis and Market Outlook(29-08-2013)
Nifty-Intra Day Chart (Aug 27 & Aug 28,2013):-
Technical Patterns and Formations in last 2 Sessions intraday charts
1- Selling between 5320-5355 on 27-08-2013
2- Support between 5118-5200 on 28-08-2013
3- 2 Sessions actual trading between 5118-5427
Negative news(weak Indian Rupee,weaker Global markets,sharp rise in Crude prices and Syria crisis) based sharp down moves and high volatility in last 2 sessions as well as strong recovery from lower levels today but it should be kept in mind that Indian markets are the stiff grip of Bears and high volatility is Bear market nature which was seen in last 2 sessions.
199 Points strong recovery from lower levels after supports between 5118-5200 but some selling was seen between 5320-5355 yesterday therefore mixed trading patterns also in last 2 sessions and more preparation is required for any side decisive moves. Expected that finally down moves will be seen below today lowest(5118) but firstly Nifty will firstly remain range bound between 5118-5355 and will prepare for next decisive moves within this range. Sustaining beyond 5118-5355 should be firstly watched in the coming sessions for next Short Term or decisive moves confirmations.
 |
| Just click on chart for its enlarged view |
1- Selling between 5320-5355 on 27-08-2013
2- Support between 5118-5200 on 28-08-2013
3- 2 Sessions actual trading between 5118-5427
Conclusions from 2 Sessions intra day chart analysis
Negative news(weak Indian Rupee,weaker Global markets,sharp rise in Crude prices and Syria crisis) based sharp down moves and high volatility in last 2 sessions as well as strong recovery from lower levels today but it should be kept in mind that Indian markets are the stiff grip of Bears and high volatility is Bear market nature which was seen in last 2 sessions.
199 Points strong recovery from lower levels after supports between 5118-5200 but some selling was seen between 5320-5355 yesterday therefore mixed trading patterns also in last 2 sessions and more preparation is required for any side decisive moves. Expected that finally down moves will be seen below today lowest(5118) but firstly Nifty will firstly remain range bound between 5118-5355 and will prepare for next decisive moves within this range. Sustaining beyond 5118-5355 should be firstly watched in the coming sessions for next Short Term or decisive moves confirmations.
Mid-session Outlook(28-08-2013)
Following line was told today at 08:23 AM in Firm Grip of Bears on Indian Markets
Only testing of 2nd support range was told and Nifty recovered sharply after intraday low formation between mentioned range at 5118.85. As volatility remains high in Bear markets therefore being seen today and coming sessions will remain range bound between 5118-5355 as well as market will firstly prepare for next Short Term Trend within this range.
testing of above mentioned 2nd support range(5075-5140) can not be ruled out in the coming sessions.
Only testing of 2nd support range was told and Nifty recovered sharply after intraday low formation between mentioned range at 5118.85. As volatility remains high in Bear markets therefore being seen today and coming sessions will remain range bound between 5118-5355 as well as market will firstly prepare for next Short Term Trend within this range.
Which Website predicted so clearly Bearish Markets in whole India except
enjoydailyprofits.blogspot.in
enjoydailyprofits.blogspot.in
Firm Grip of Bears on Indian Markets
Nifty-EOD Chart (27-Aug-2013):-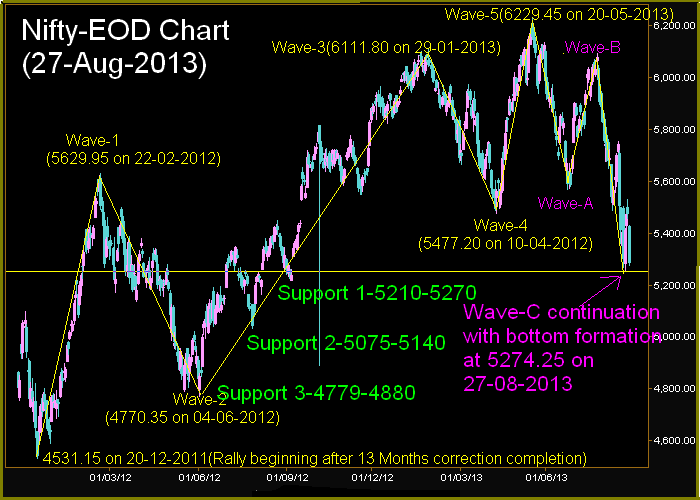 |
| Just click on chart for its enlarged view |
1- 4531.15 on 20-12-2011(Rally beginning after 13 Months correction completion)
2- Wave-1(5629.95 on 22-02-2012)
3- Wave-2(4770.35 on 04-06-2012)
4- Wave-3(6111.80 on 29-01-2013)
5- Wave-4(5477.20 on 10-04-2012)
6- Wave-5(6229.45 on 20-05-2013) and 'ABC' correction continuation.
7- Wave-A(5566.25 on 24-06-2013)
8- Wave-B(6093.35 on 23-07-2013)
9- Wave-C continuation with bottom formation at 5274.25 on 27-08-2013
Conclusions from EOD chart analysis
Indian markets are in deep Bear phase today but When Long Term Trend was up and previous closing of Nifty was at 5886.20 on 26-07-2013 then following line was told on 29-07-2013 in Last hope for Bulls at 5792:-
As 'ABC' correction begun after 5 waves of Bullish market completion at 6229.45 on 20-05-2013 therefore correction of whole up moves will be seen which started from 4531.15 on 20-12-2011
As was told same happened and 50% retracement of rally between 4531.15-6229.45 has been completed,Retracement levels of mentioned range are being repeated which were updated on 31-07-2013 in Technical Analysis and Market Outlook(31-07-2013):-
13.0%-6008
23.6%-5828
27.0%-5770
38.2%-5580
50.0%-5380
61.8%-5179
70.7%-5028
76.4%-4931
78.6%-4894
88.6%-4724
Above lines were reminded many times in previous Outlooks and following lines with supports levels upto 4779 were updated on 19-08-2013 in Huge Bearish Pattern formation in last 11 months because deeper correction was expected:-
As we don't want to create panic through updating next expected levels after sustaining below 5447 therefore only giving next following support levels upto 4779:-
1- 5210-5270
2- 5075-5140
3- 4779-4880
Whatsoever crashing like deeper down moves were seen yesterday those were already updated well in advance in all the Outlooks of previous sessions. Support was seen near and between above mentioned 1st support range(5210-5270) in last 5 sessions and firstly sustaining it beyond should be watched today for bounce back after yesterday sharp down or immediate more down moves below 5210.
As Indian Markets are in the firm Grip of Bears and now Bearish market is very much on as well as its continuation is very much expected in the coming sessions,months and may be years also therefore following lines are being repeated which were told on 19-08-2013 in Huge Bearish Pattern formation in last 11 months:-
It is confirm that Indian markets are in Bear phase and Economic Outlook is also gloomy in the next months as well as political uncertainty can not be ruled out after next General Elections therefore Indian markets will remain in the grip of Bears. Pull Back and Relief rallies will be seen after regular intervals after intraday or 1/2 day consolidations but until complete consolidation will not complete on Intraday,EOD and Weekly charts till then Long Term Trend will not reverse.
Pre-open Outlook(28-08-2013)
Sentiment is most depressed after after yesterday sharp fall and deep Red all Global markets therefore gap down opening will be seen in Indian markets and testing of above mentioned 2nd support range(5075-5140) can not be ruled out in the coming sessions.
Which Website predicted so clearly Bearish Markets in whole India except
Technical Analysis and Market Outlook(27-08-2013)
Nifty-Intra Day Chart (Aug 23 & Aug 26,2013):-
Technical Patterns and Formations in last 2 Sessions intraday charts
1- Whole day up moves in Bearish Rising channel on 23-08-2013.
2- Selling between 5490-5528 on 26-08-2013
3- 2 Sessions actual trading between 5378-5528
As most Asian markets were trading with good gains today morning therefore firstly gap up opening and most of the time positive zone trading but higher levels selling today after Bearish Rising channel formation on 23-08-2013 therefore finally down moves are expected in the coming sessions after completion of 3 sessions Pull Back Rally.
 |
| Just click on chart for its enlarged view |
1- Whole day up moves in Bearish Rising channel on 23-08-2013.
2- Selling between 5490-5528 on 26-08-2013
3- 2 Sessions actual trading between 5378-5528
Conclusions from 2 Sessions intra day chart analysis
As most Asian markets were trading with good gains today morning therefore firstly gap up opening and most of the time positive zone trading but higher levels selling today after Bearish Rising channel formation on 23-08-2013 therefore finally down moves are expected in the coming sessions after completion of 3 sessions Pull Back Rally.
Mid-session Outlook-2(23-08-2013)
As good recovery in Indian Rupee from intraday lower levels therefore Indian markets are up but slow up moves and with Bearish Rising channel since opening today therefore expected that Nifty will not sustain above next resistances range(5450-5475).
Mid-session Outlook(23-08-2013)
Resistances above today higher levels between (5450-5475) and Nifty is preparing for next moves just below it between 5380-5452 with intraday volatility firstly and emergence of selling signals also.
Technical Analysis and Market Outlook(23-08-2013)
Nifty-Intra Day Chart (22-Aug-2013):-
Technical Patterns and Formations in today intraday charts
1- Bullish Falling Channel consolidation pattern formations.
2- Sharp up moves beginning after strong opening of European markets at 12:30 PM.
3- Follow up Bullish Falling Channel consolidation pattern formations between 01:00-02:00 PM.
4- Last 1 hour up moves in Bearish Rising Wedge formations.
5- Whole day trading between 5255-5418
Whole day up moves after lower levels consolidations and some more consolidation was also seen in mid session but sharp up moves started after strong opening of European markets at 12:30 PM and sudden 50 points jump of Dow'Jones Futures after 12:15 PM. Although follow up Bullish Falling Channel consolidation pattern formations also seen between 01:00-02:00 PM but today up moves were on the back of strong Global cues and last 1 hour up moves were in Bearish Rising Wedge formations therefore follow up consolidation is must for sustaining above today highs and next resistance range(5450-5475).
All trends are down and Indian markets are in confirm Bear phase,today like Bounce Back may be seen any day because Short Term Indicators are oversold and Volatility remains high in Bear markets. Until complete consolidation will not be seen minimum on Daily charts till then any decisive up move will not be seen. Follow up selling and sustaining below next resistance range(5450-5475) will mean fresh down moves to test next support range(5210-5270) or below it also.
 |
| Just click on chart for its enlarged view |
1- Bullish Falling Channel consolidation pattern formations.
2- Sharp up moves beginning after strong opening of European markets at 12:30 PM.
3- Follow up Bullish Falling Channel consolidation pattern formations between 01:00-02:00 PM.
4- Last 1 hour up moves in Bearish Rising Wedge formations.
5- Whole day trading between 5255-5418
Conclusions from intra day chart analysis
Whole day up moves after lower levels consolidations and some more consolidation was also seen in mid session but sharp up moves started after strong opening of European markets at 12:30 PM and sudden 50 points jump of Dow'Jones Futures after 12:15 PM. Although follow up Bullish Falling Channel consolidation pattern formations also seen between 01:00-02:00 PM but today up moves were on the back of strong Global cues and last 1 hour up moves were in Bearish Rising Wedge formations therefore follow up consolidation is must for sustaining above today highs and next resistance range(5450-5475).
All trends are down and Indian markets are in confirm Bear phase,today like Bounce Back may be seen any day because Short Term Indicators are oversold and Volatility remains high in Bear markets. Until complete consolidation will not be seen minimum on Daily charts till then any decisive up move will not be seen. Follow up selling and sustaining below next resistance range(5450-5475) will mean fresh down moves to test next support range(5210-5270) or below it also.
Pre-Closing Outlook(22-08-2013)
Firstly lower levels and after that follow up consolidations in last 2 hours therefore continuation of Pull Back Rally. Next resistances are between 5450-5475 and sustaining beyond it will be watched in the coming sessions for the fate of today started rally.
Mid-session Outlook(22-08-2013)
Following support range was updated on 19-08-2013 in "Huge Bearish Pattern formation in last 11 months":-
1- 5210-5270
2- 5075-5140
3- 4779-4880
Nifty got supports between 1st support range after weak opening and recovered after lowest formation at 5254.05. As Short Term Indications are oversold and some consolidation between 5263-5310 therefore Bounce back is being seen and next resistances are between 5450-5475.
Expected that Nifty will remain range bound between 5263-5475 in the coming sessions and will prepare for next Short/Intermediate Term Trend within this range.
Technical Analysis and Market Outlook(22-08-2013)
Daily Indicators and Averages Analysis
Nifty-Daily Indicators and Averages Analysis Chart(21-Aug-2013):-
 |
| Just click on chart for its enlarged view |
8 Day EMA is at- 5492
21 Day EMA is at- 5637
55 Day EMA is at- 5761
200 Day EMA is at- 5764
2- Bollinger Band- Lower Band moving down with the slipping of Nifty and indicating some up moves.
3- Slow Stochastic- Entering into oversold zone.
4- MACD- MACD line is below Average line and gap widen between both lines near oversold line
5- ROC- Entering into oversold zone.
6- RSI- Entering into oversold zone.
- Conclusions from Daily Indicators and Averages Analysis
Although most indicators are entering into oversold zone but not deeply oversold and positive divergence also not seen yet therefore some more down moves are still left before trend reversal and the beginning of any decisive up move.
Mid-session Outlook(21-08-2013)
Although Nifty was more than 100 points up within 1st minute today but we were not Bullish and cautioned in previous Outlook as well as gave confirmation level also. Following lines were told today at 09:42:00 AM in Post-open Outlook:-
1- As Bearish markets remain highly volatile therefore today up moves may be a part of volatility also.
2- 11 Months huge Head and Shoulders patterns formation and its neckline(at 5477.20) was broken down on 19-08-2013,Nifty is hovering it around at this moment and firstly sustaining beyond it should be watched for next Long Term Trend confirmations.
Following line was told yesterday in Mid-session Outlook-3 and Pre-Closing Outlook:-
1- Expected that Nifty will not sustain above today highest(5417) and finally down moves will be seen below 5360.
Today lowest is at 5361.10 after loosing more than 140 points today and steep fall will be seen after valid break down below 5360/5306 as well as its high possibility.
Post-open Outlook(21-08-2013)
Although mixed intraday patterns in last 2 Sessions between 5306-5465 but whole day good consolidation was seen on 19-08-2013 therefore up moves seen today. As Bearish markets remain highly volatile therefore today up moves may be a part of volatility also.
11 Months huge Head and Shoulders patterns formation and its neckline(at 5477.20) was broken down on 19-08-2013,Nifty is hovering it around at this moment and firstly sustaining beyond it should be watched for next Long Term Trend confirmations.
11 Months huge Head and Shoulders patterns formation and its neckline(at 5477.20) was broken down on 19-08-2013,Nifty is hovering it around at this moment and firstly sustaining beyond it should be watched for next Long Term Trend confirmations.
Technical Analysis and Market Outlook(21-08-2013)
Nifty-Intra Day Chart (Aug 19 & Aug 20,2013):-
Technical Patterns and Formations in last 2 Sessions intraday charts
1- Down moves in Bullish Falling Channel on 19-08-2013
2- Consolidation at lower levels between 5360-5400 on 19-08-2013
3- Up moves in Bearish Rising Channel on 20-08-2013
4- Selling between 5405-5415 on 20-08-2013
5- More than 8 hours trading between 5360-5420 with mixed patterns in last 2 sessions.
6- 2 Sessions actual trading between 5306-5465
As most depressing news flow(Indian Rupee weakening by 2% and weaker Global markets) therefore Nifty slipped more than 100 points within first 2 minutes but strong recovery from lower levels also because whole day good consolidation yesterday. More than 2 hours consolidation between 5360-5400 yesterday and more than 5 hours trading within this range today with higher levels selling.
It is clear from last 2 sessions trading that both consolidation and selling seen between 5306-5465 and more than 8 hours trading between 5360-5420 with mixed intraday patterns therefore Indian markets are not mature for any side decisive moves and will firstly prepare for next moves between 5360-5420 and sustaining it beyond should be watched in the coming sessions for next Short Term Trend confirmations.
 |
| Just click on chart for its enlarged view |
1- Down moves in Bullish Falling Channel on 19-08-2013
2- Consolidation at lower levels between 5360-5400 on 19-08-2013
3- Up moves in Bearish Rising Channel on 20-08-2013
4- Selling between 5405-5415 on 20-08-2013
5- More than 8 hours trading between 5360-5420 with mixed patterns in last 2 sessions.
6- 2 Sessions actual trading between 5306-5465
Conclusions from 2 Sessions intra day chart analysis
As most depressing news flow(Indian Rupee weakening by 2% and weaker Global markets) therefore Nifty slipped more than 100 points within first 2 minutes but strong recovery from lower levels also because whole day good consolidation yesterday. More than 2 hours consolidation between 5360-5400 yesterday and more than 5 hours trading within this range today with higher levels selling.
It is clear from last 2 sessions trading that both consolidation and selling seen between 5306-5465 and more than 8 hours trading between 5360-5420 with mixed intraday patterns therefore Indian markets are not mature for any side decisive moves and will firstly prepare for next moves between 5360-5420 and sustaining it beyond should be watched in the coming sessions for next Short Term Trend confirmations.
Pre-Closing Outlook(20-08-2013)
As volatility remain high in Bear markets therefore trading positions have to be understood after every decisive intraday move because small traders stop losses trigger during such volatility.
Consolidation range of 5360-5400 was updated yesterday in Technical Analysis and Market Outlook(20-08-2013) and last 5 hours trading within this range with higher levels selling but lower levels consolidations also seen today
As higher levels selling patterns today and all trends are down therefore expected that Nifty will not sustain above today highest(5417) and finally down moves will be seen below 5360 but volatile day today and technical positions reverses in such volatility also therefore view is cautious and finally next Short Term moves confirmation is must through sustaining beyond 5360-5400 because good consolidation was also seen between this range yesterday.
Subscribe to:
Posts (Atom)